CC0-1.0 Universal
FAIR Data & Code
NASA OSDR
LINCS L1000
Broad Drug Hub
PrimeKG
Open Targets
R 4.4.3 / metafor
Spaceflight Oncogenic Biomarkers & Their Transcriptomic Reversal by Food-Derived Flavonoids
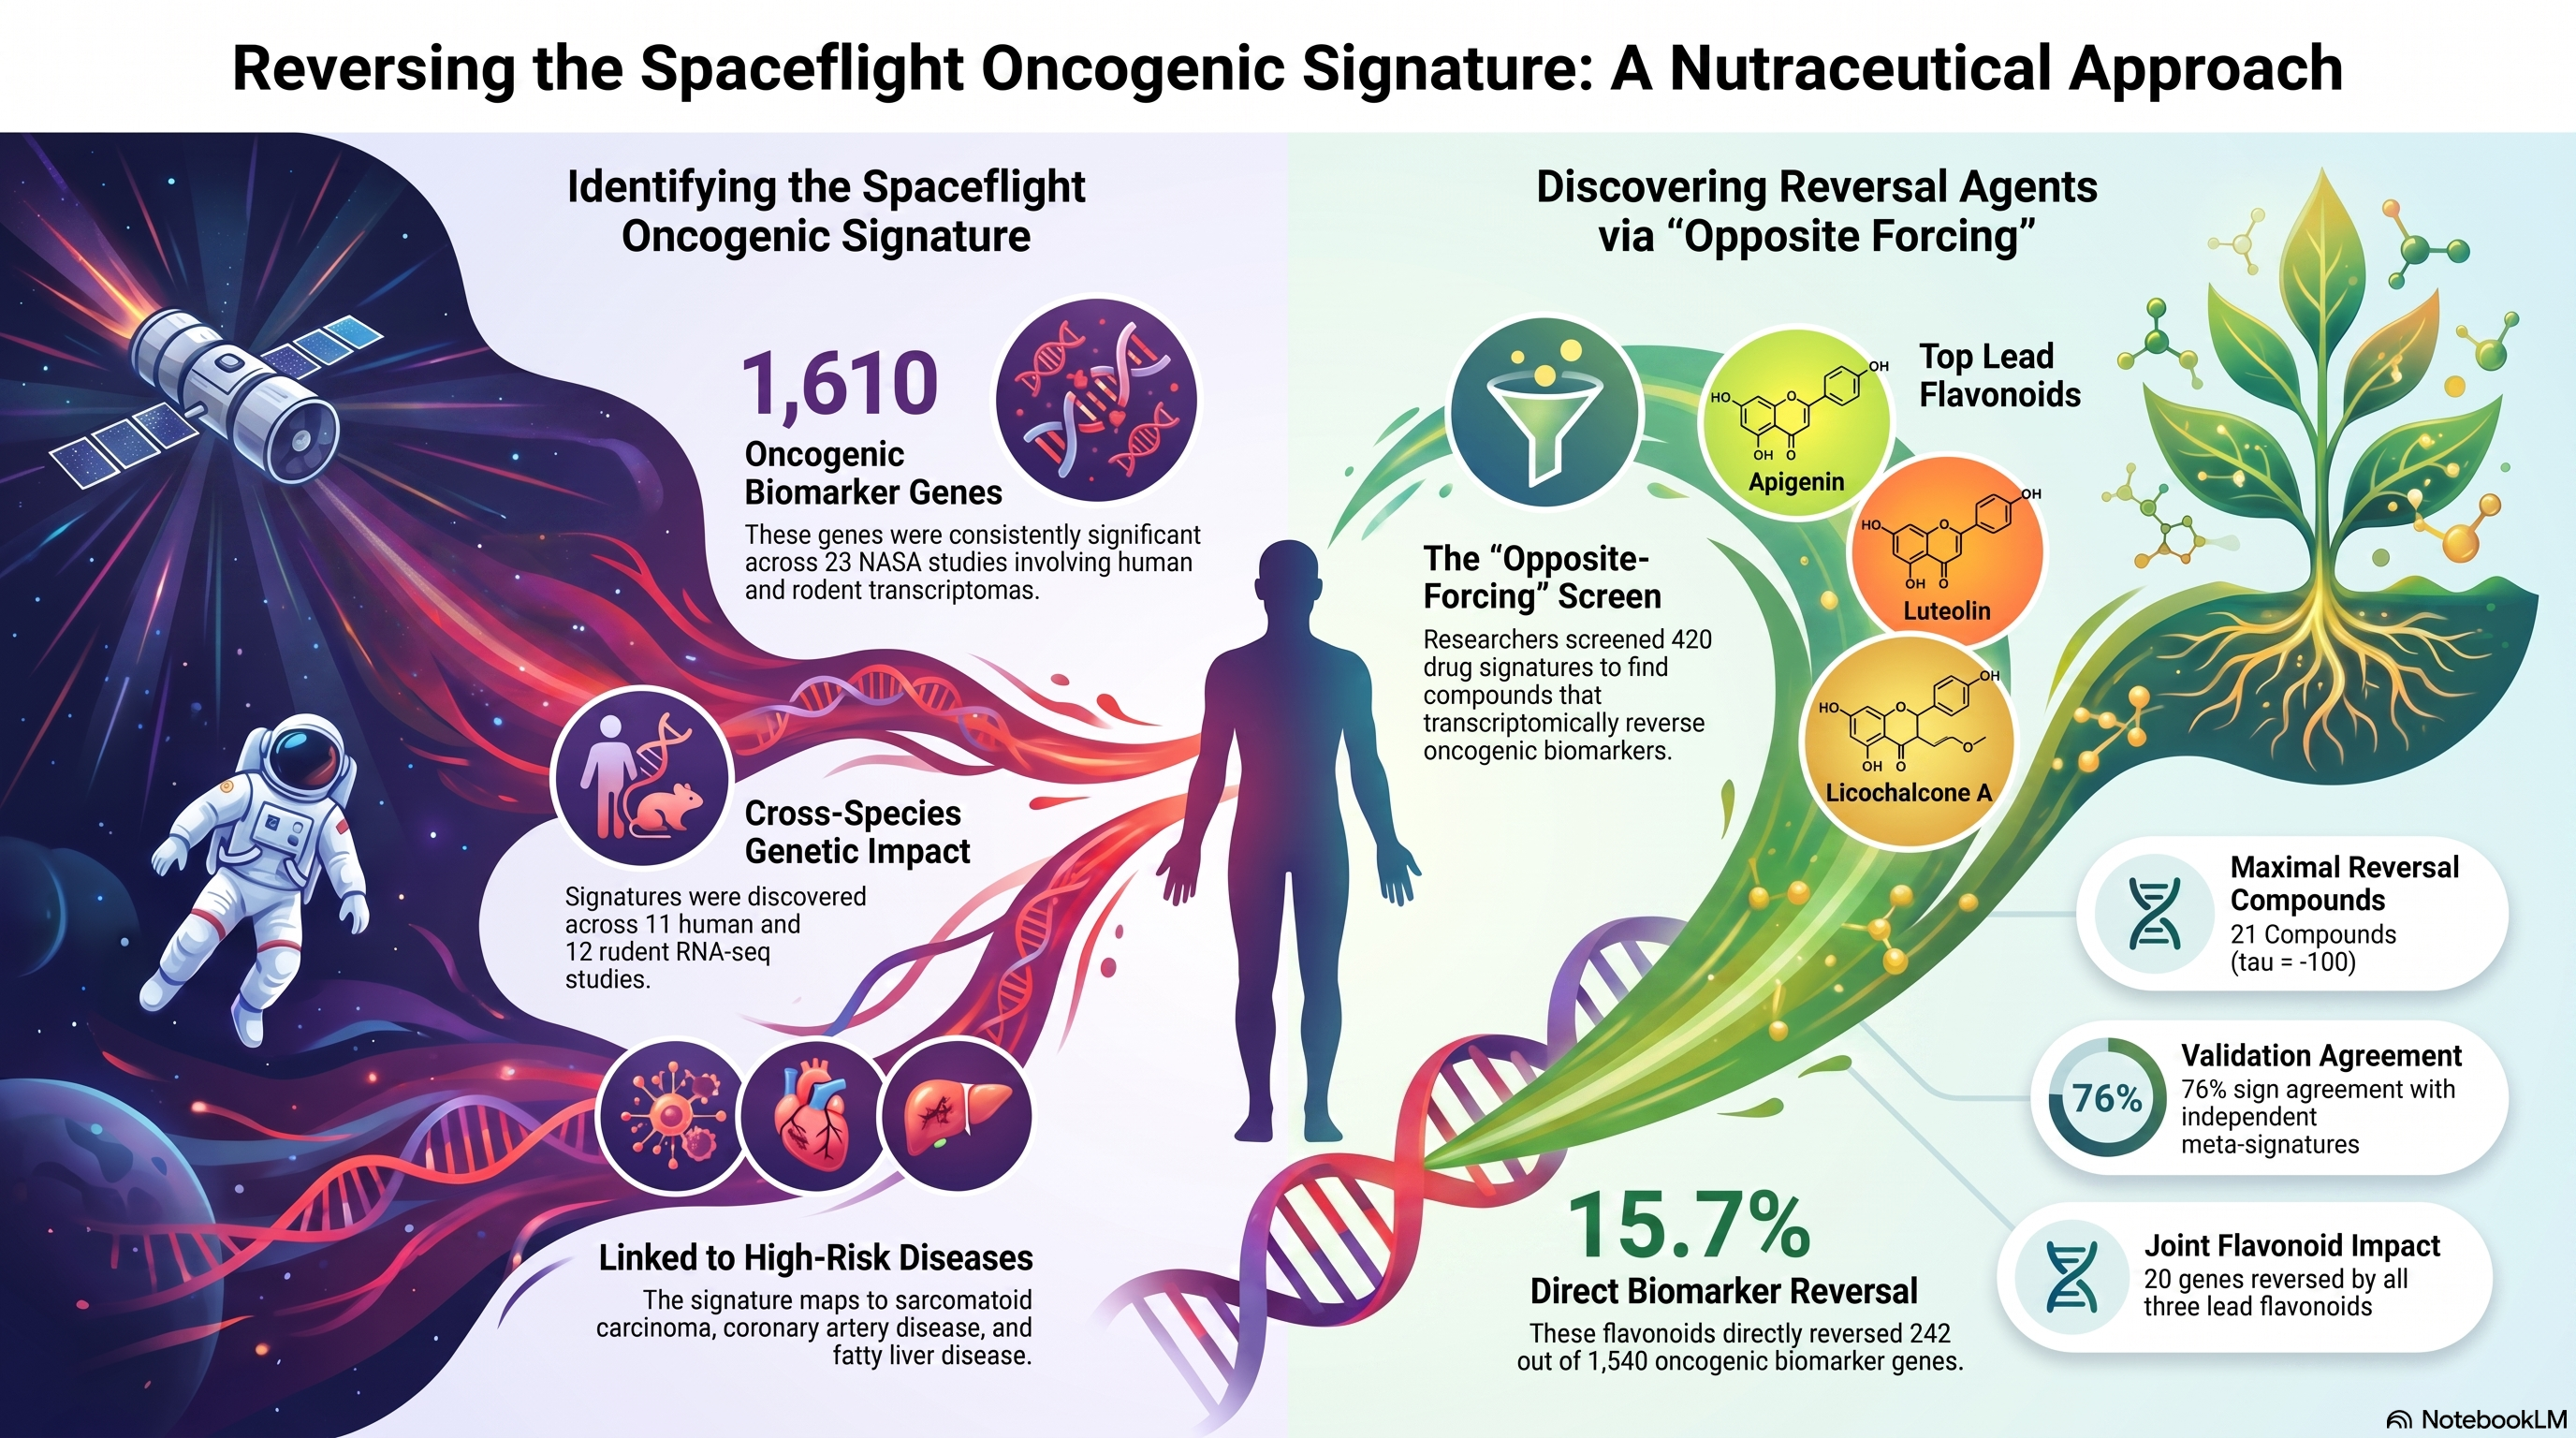
An end-to-end "opposite-forcing" computational pharmacology pipeline: re-deriving a reproducible cross-species oncogenic biomarker signature across 23 spaceflight RNA-seq studies, screening 420 LINCS L1000 perturbation profiles for transcriptomic reversal, and identifying dietary flavonoids as potent nutritional countermeasures against spaceflight-induced inflammatory and SASP remodelling.
📄 Read & Download the Complete Manuscript
Targeted for npj Microgravity · Full text, high-res figures, and supplementary tables (T3–T13c).
1,610 Biomarker Genes
Cross-species signature from 23 OSDR studies (11 human, 12 rodent) intersecting an 11,241-gene oncogene union.
ρ = 0.60 Validation
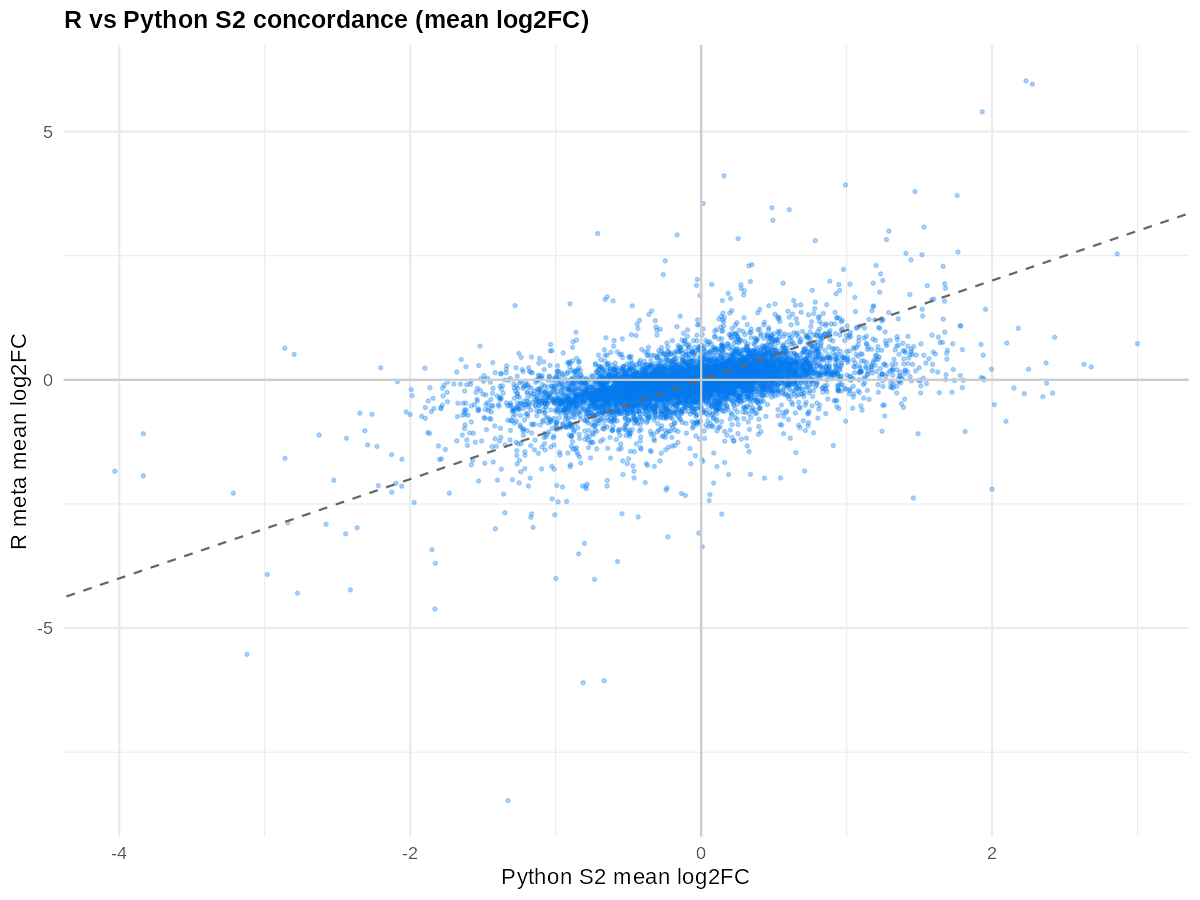
Strict concordance (76% sign agreement) validated against an independent Python cross-study meta-signature (S2).
21 Reversal Compounds
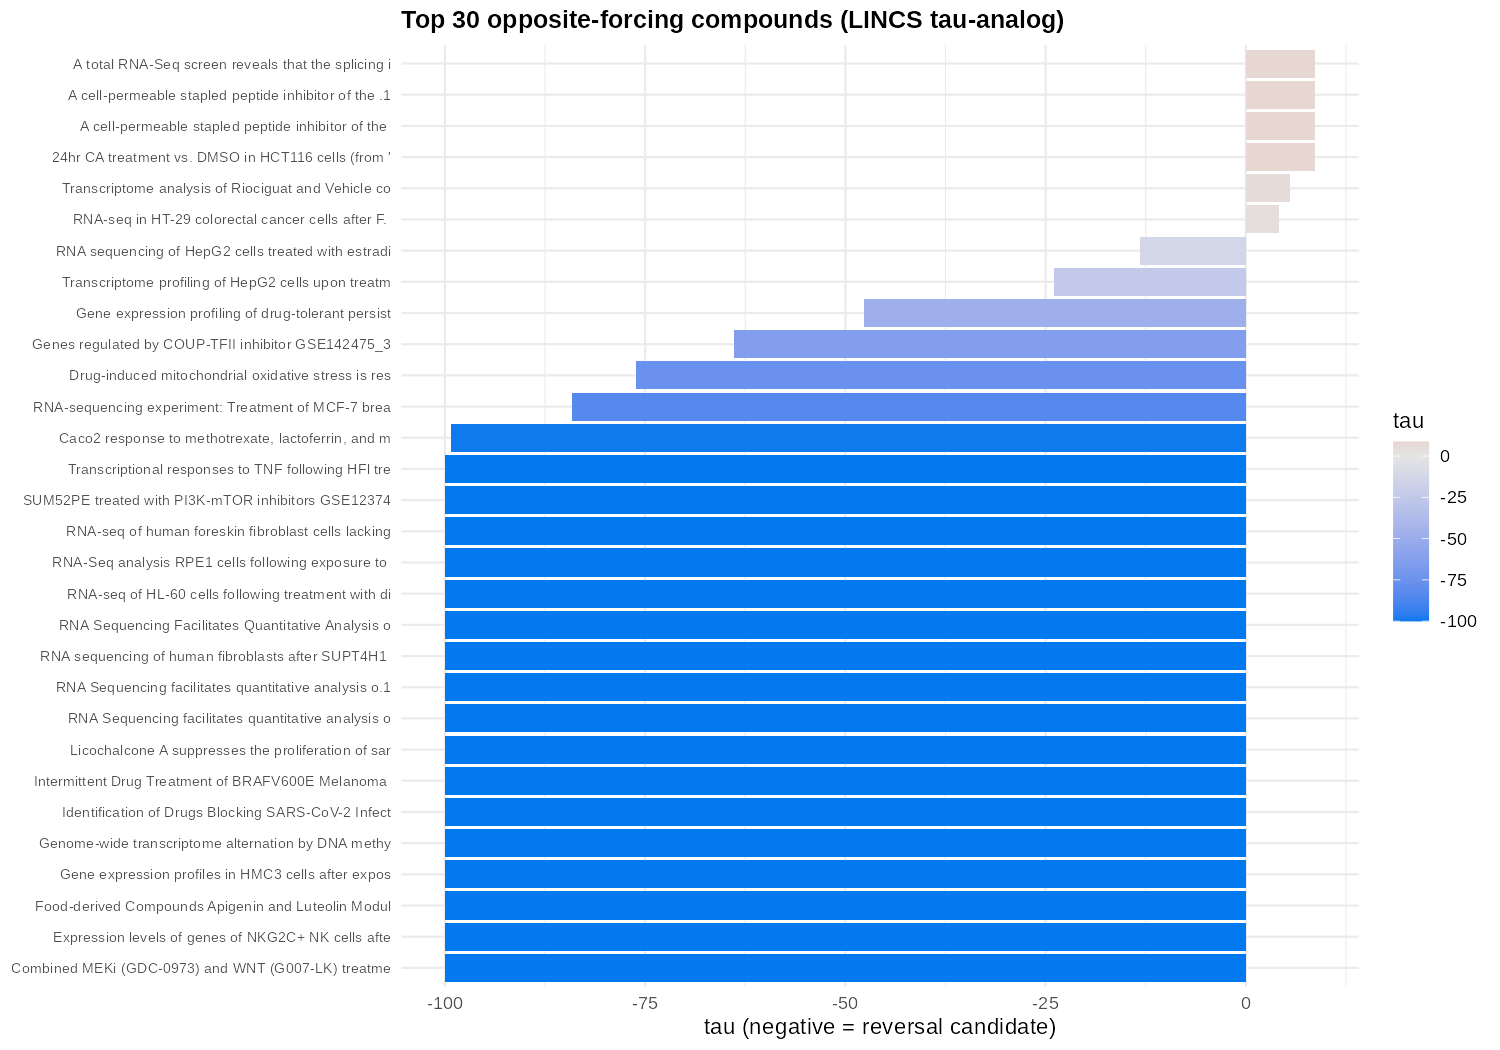
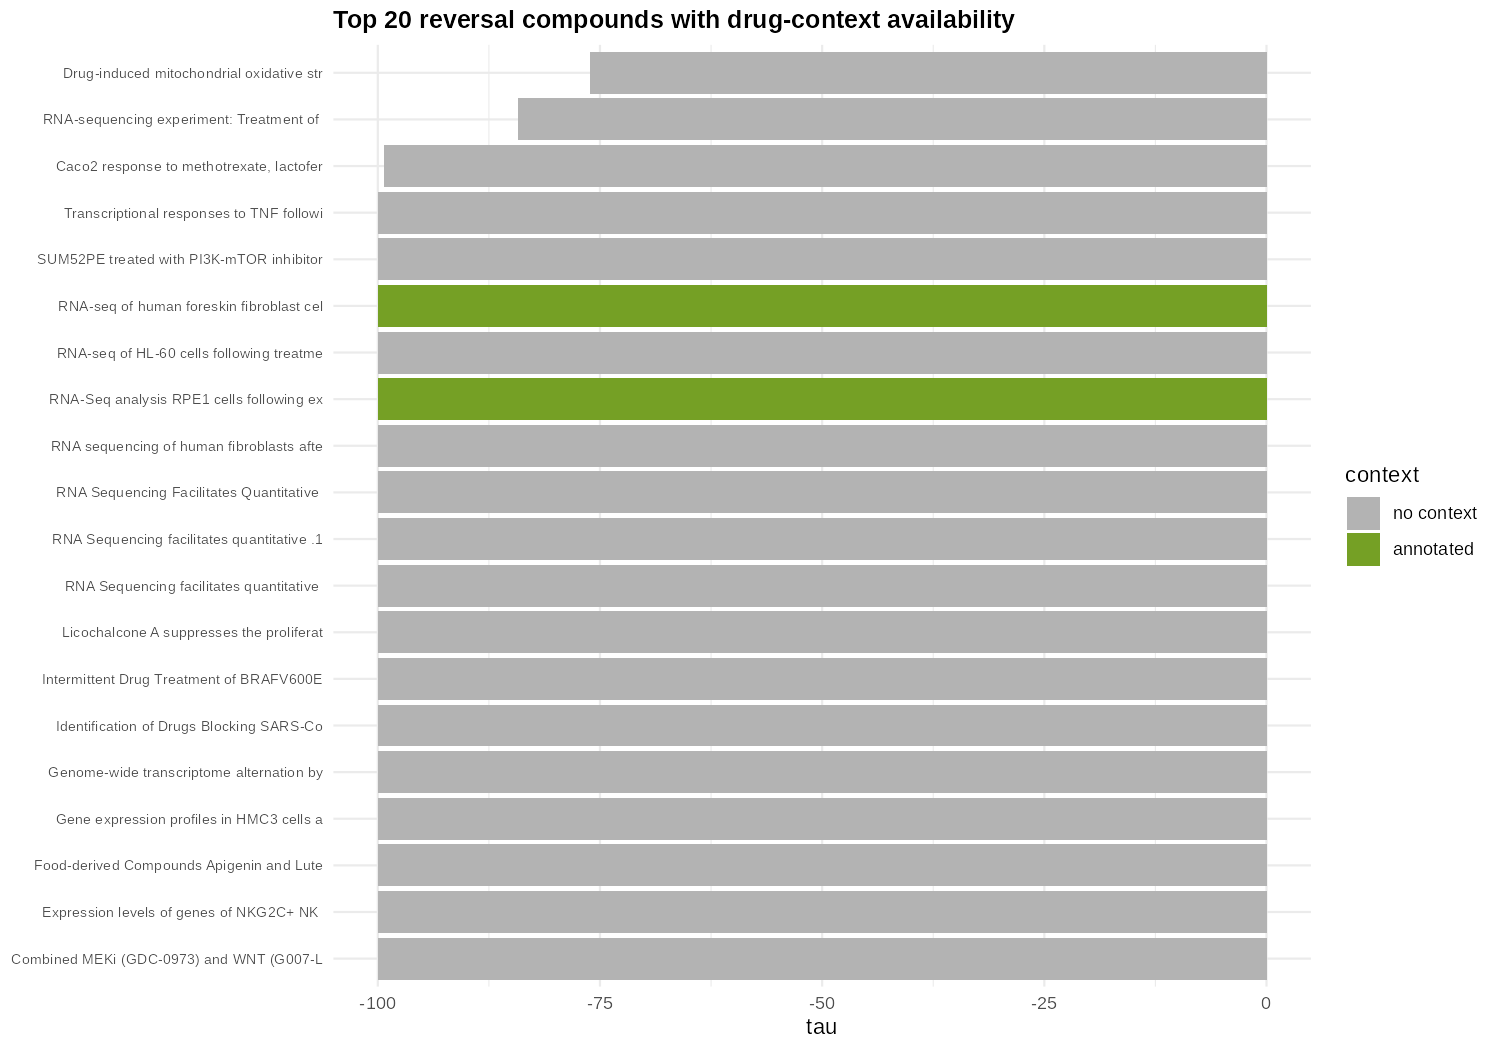
420 LINCS L1000 drug signatures screened; 21 reach maximal transcriptomic reversal (τ = −100).
242 Genes Reversed
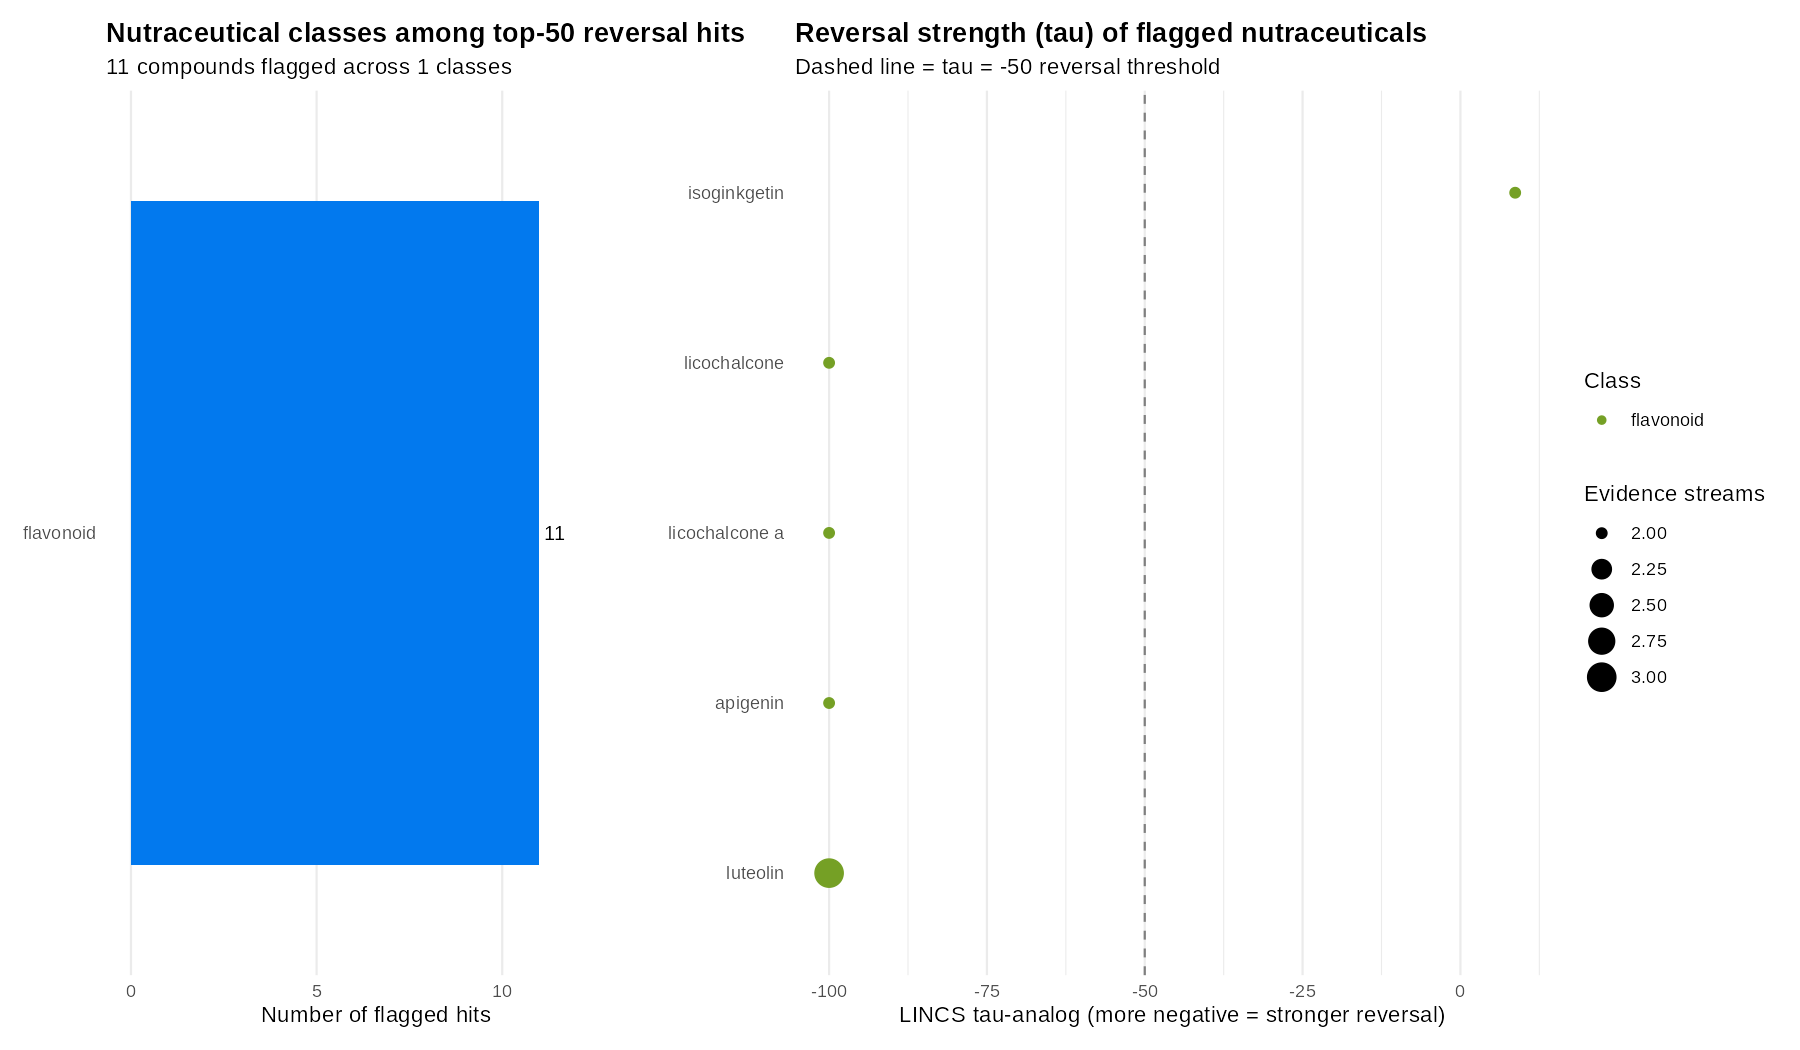
15.7% of biomarker genes counter-regulated by dietary flavonoids apigenin, luteolin, & licochalcone A.
SASP & Chemokines
Strongest reversal hits restore spaceflight-suppressed chemokines (CXCL8, MMP3, CSF2, CSF3, CXCL3).
Disease Linkage
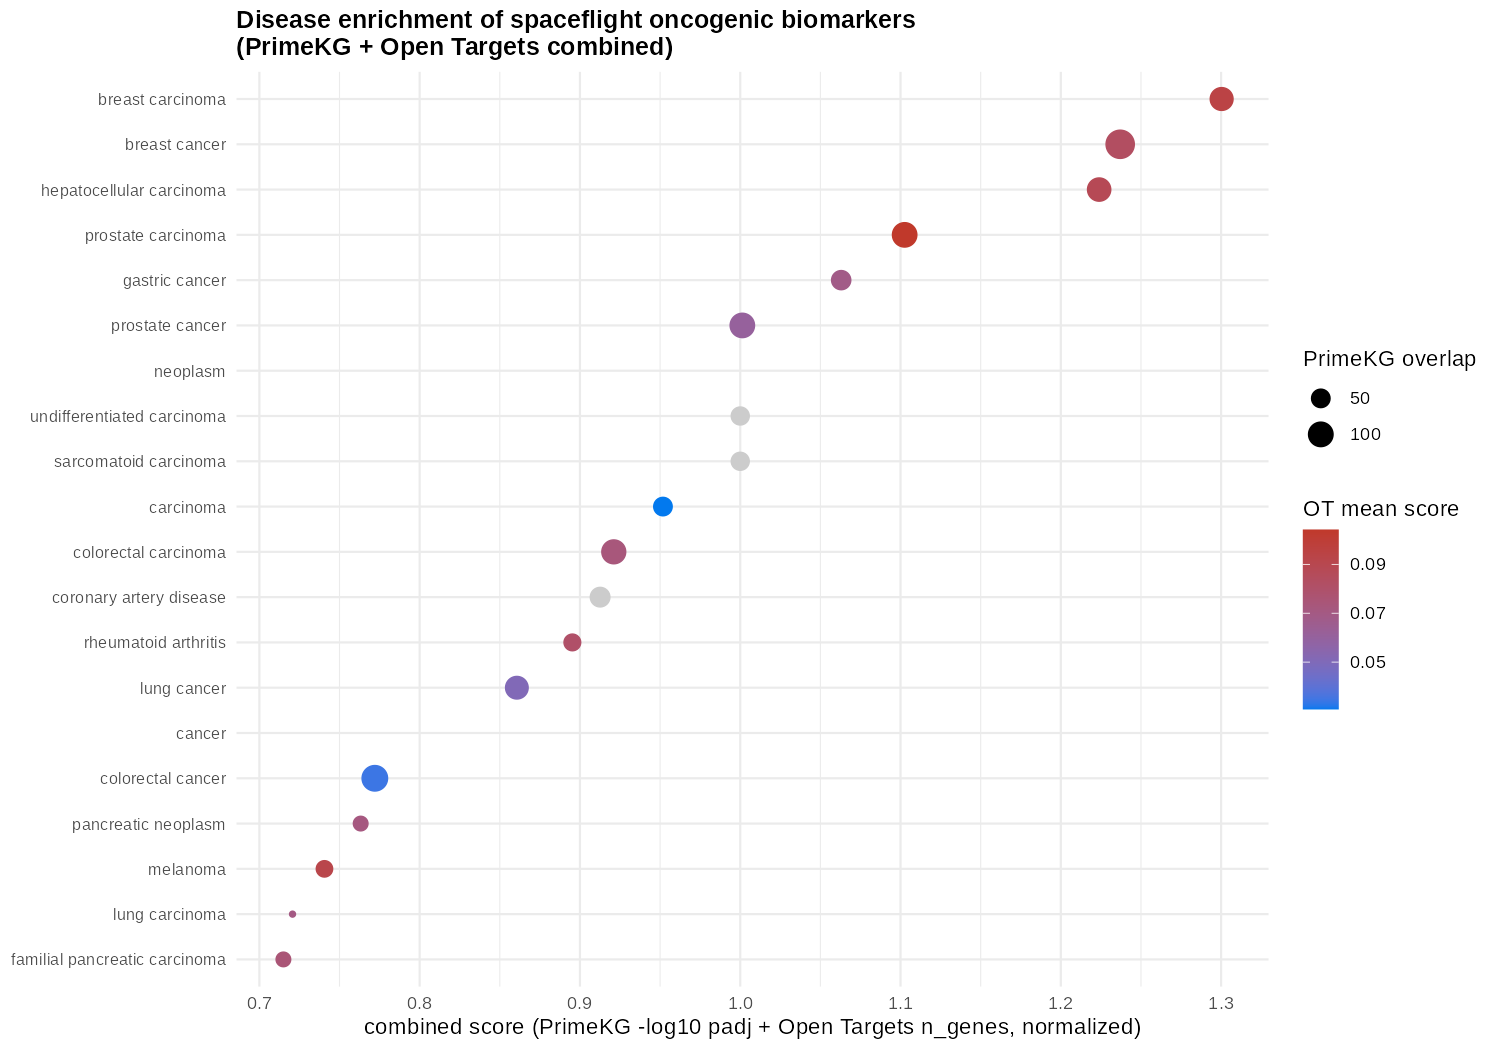
Hypergeometric enrichment maps signature to carcinomas, coronary artery disease, and metabolic syndromes.
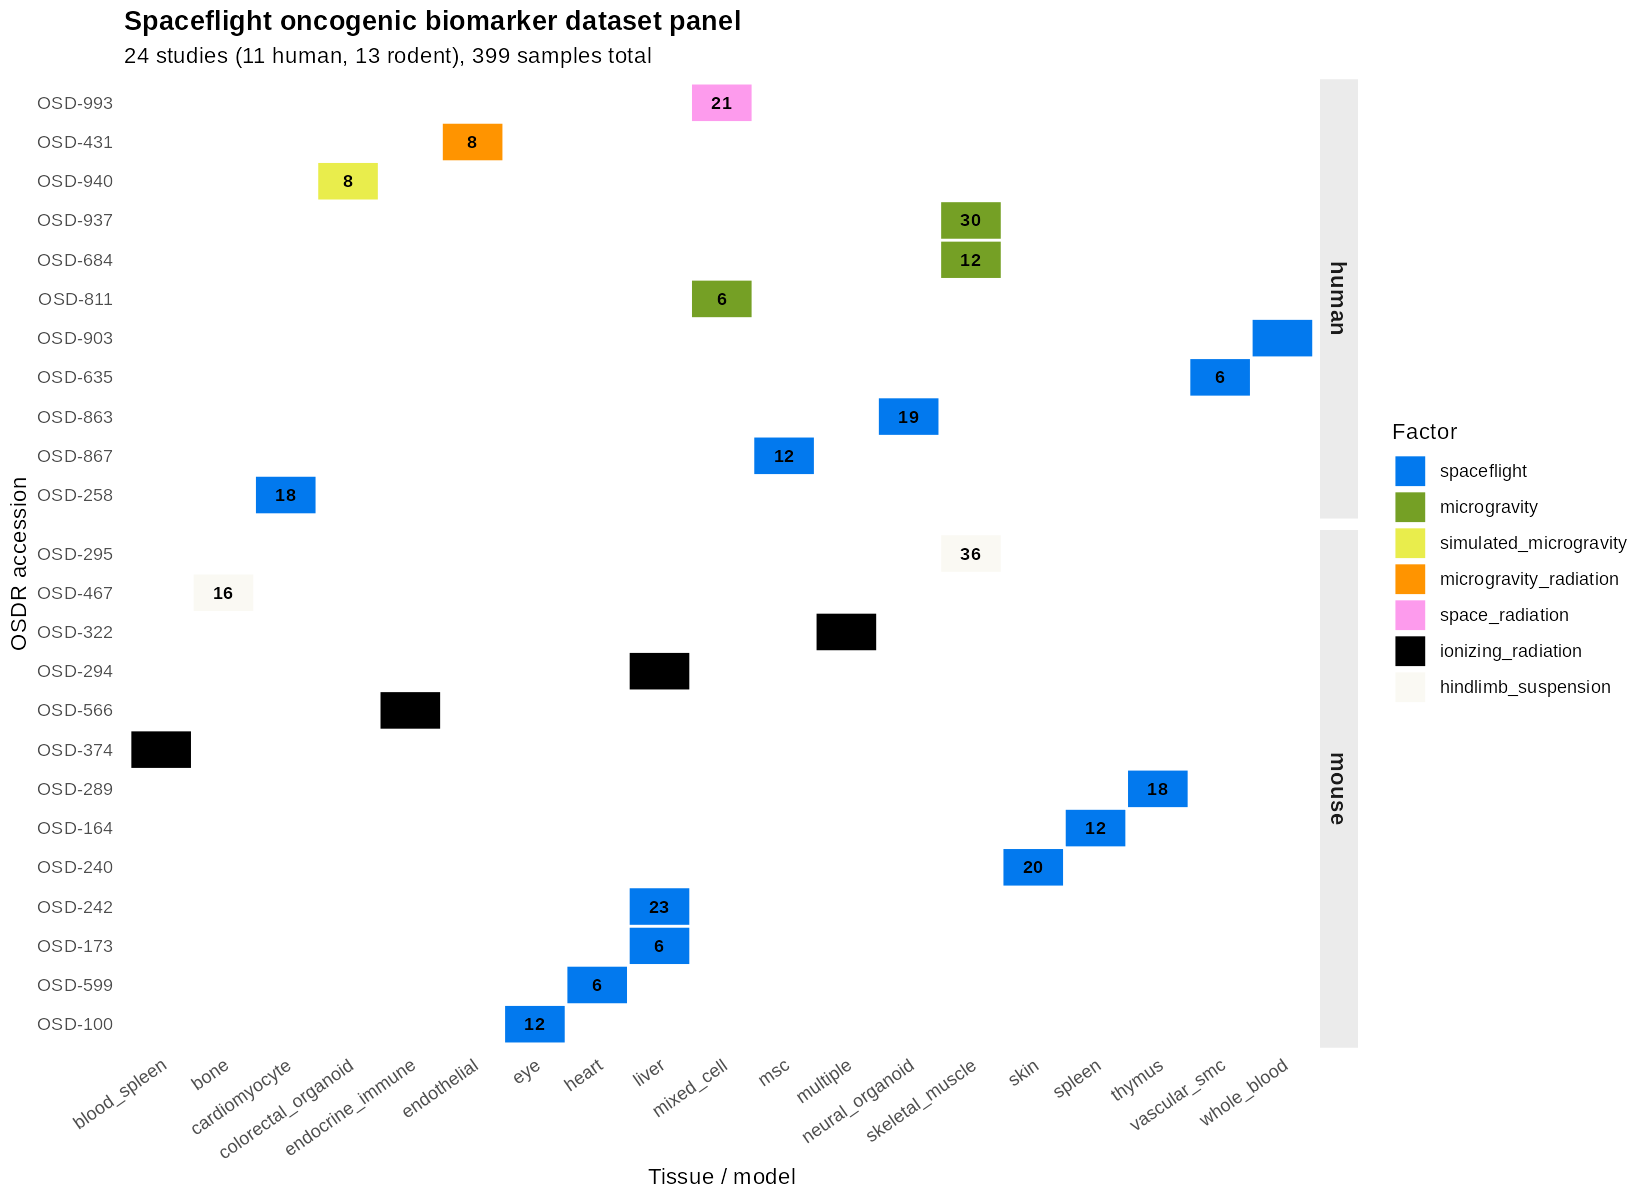
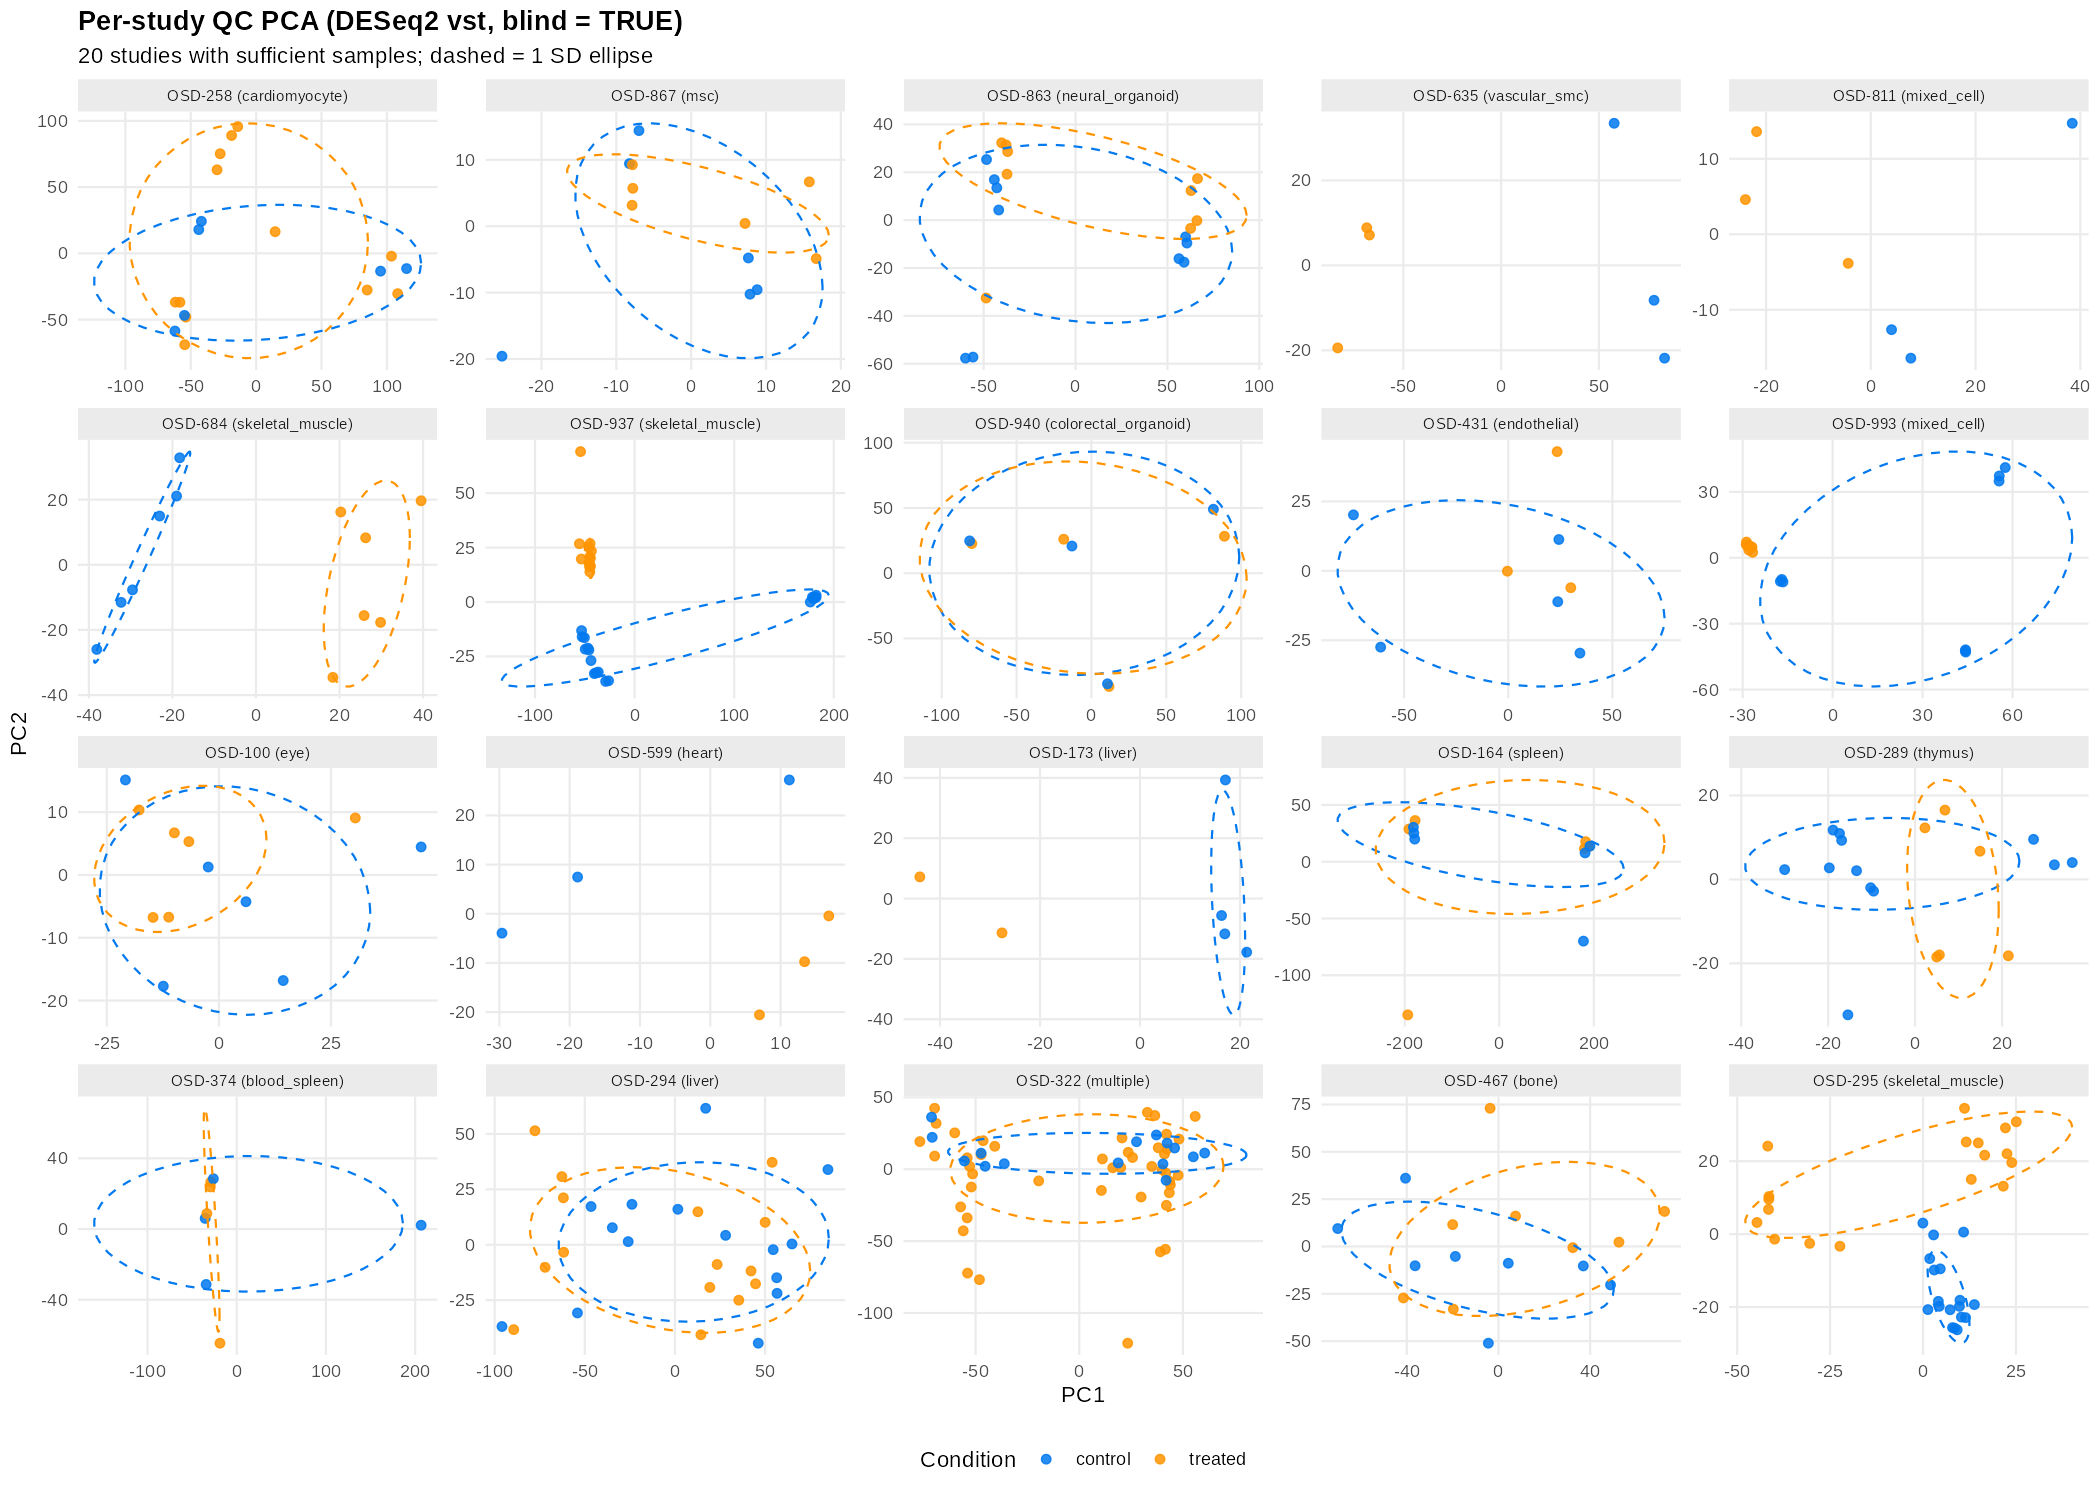
We queried the NASA Open Science Data Repository (OSDR / GeneLab) programmatically and curated a panel of 24 RNA-seq studies (11 human, 13 rodent) spanning spaceflight, simulated microgravity, hindlimb suspension, and space radiation across diverse tissues (cardiomyocytes, endothelial and vascular smooth muscle cells, skeletal muscle, neural organoids, spleen, thymus, liver, skin, eye, heart, bone, and whole blood). Per-study differential expression (DESeq2; \(p_{\mathrm{adj}} < 0.05\), \(|\text{log2FC}| > 1\)) yielded 410,121 gene-level results across 23 studies with testable contrasts. Rodent gene identifiers were mapped to human orthologs via biomaRt.
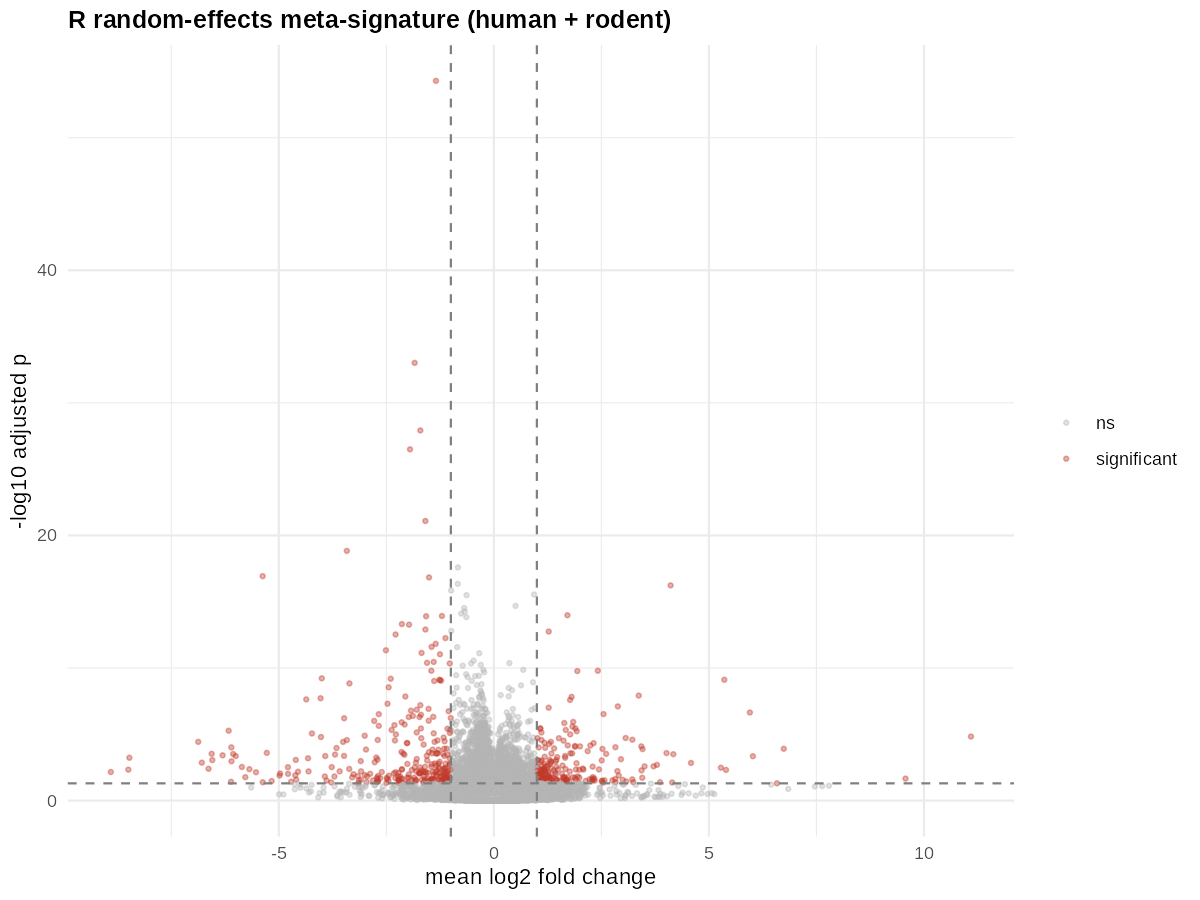
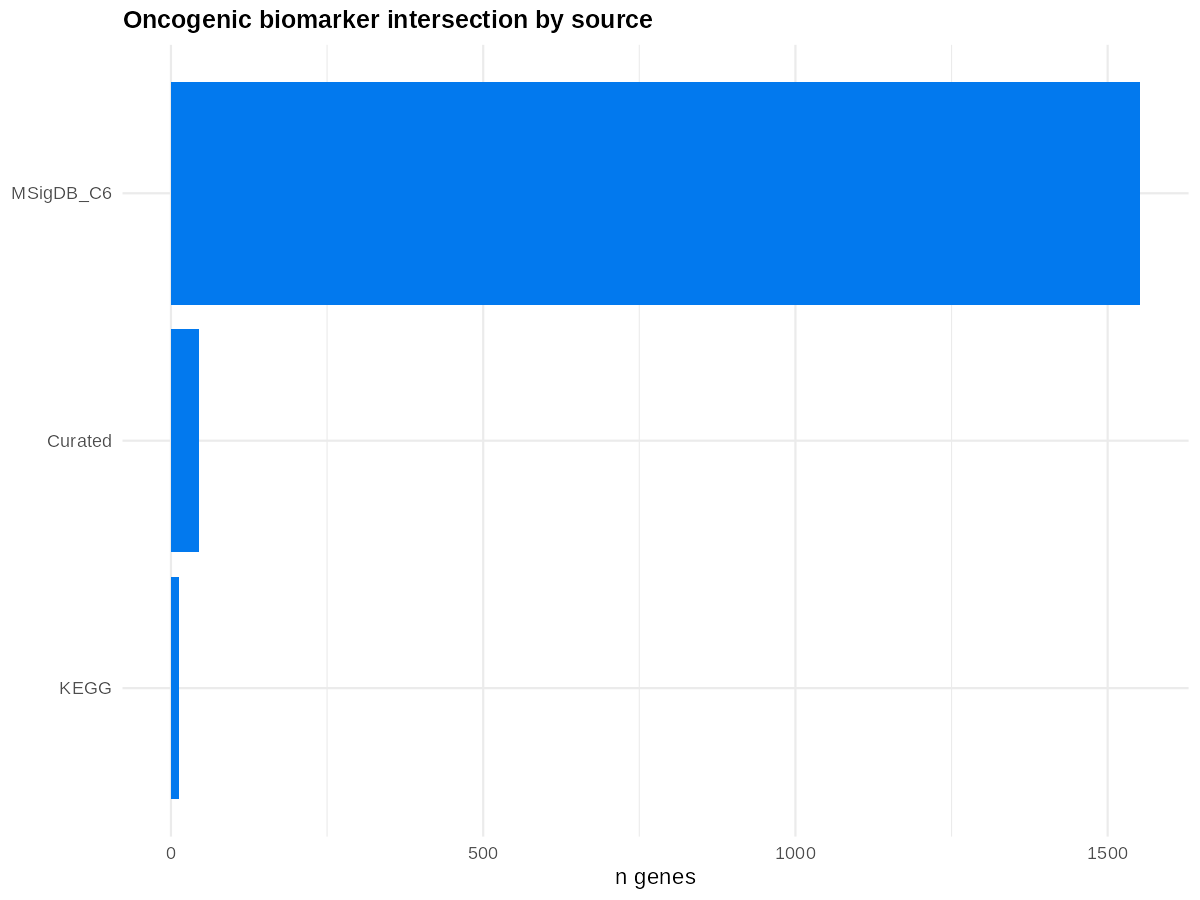
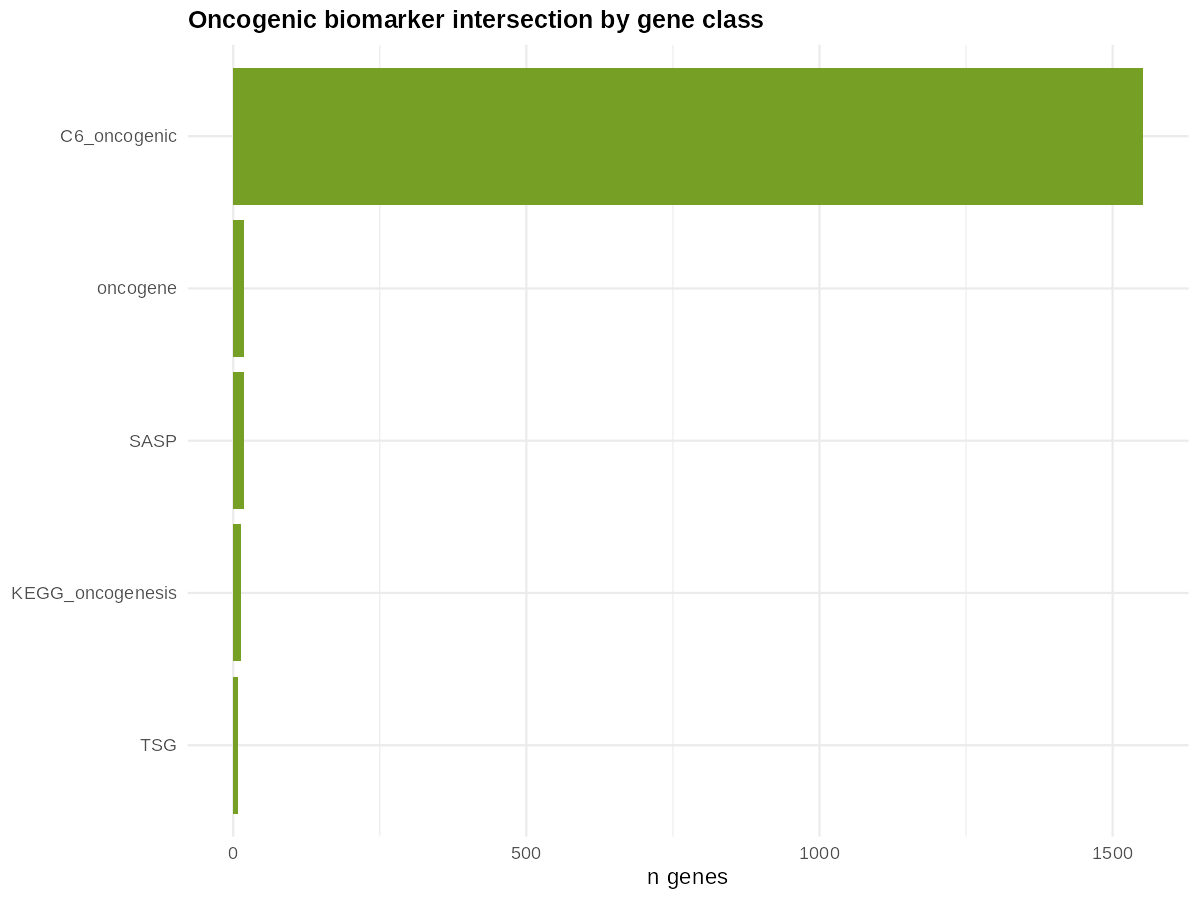
A random-effects meta-analysis (metafor::rma REML) scored 40,211 genes, identifying 3,668 genes significant at \(p_{\mathrm{adj}} < 0.05\). To isolate genes with direct oncogenic relevance, we intersected these meta-significant genes with an 11,241-gene oncogene union assembled from MSigDB C6 oncogenic signatures (10,927 genes), KEGG oncogenesis pathways (931 genes), and curated oncogene/tumour-suppressor/SASP lists (195 genes).
To verify reproducibility, the derived R meta-signature was benchmarked against an independent Python cross-study meta-signature (S2) from the companion repository astronaut-oncogene-biomarkers. Across 19,484 overlapping genes, the two pipelines demonstrated exceptional concordance.
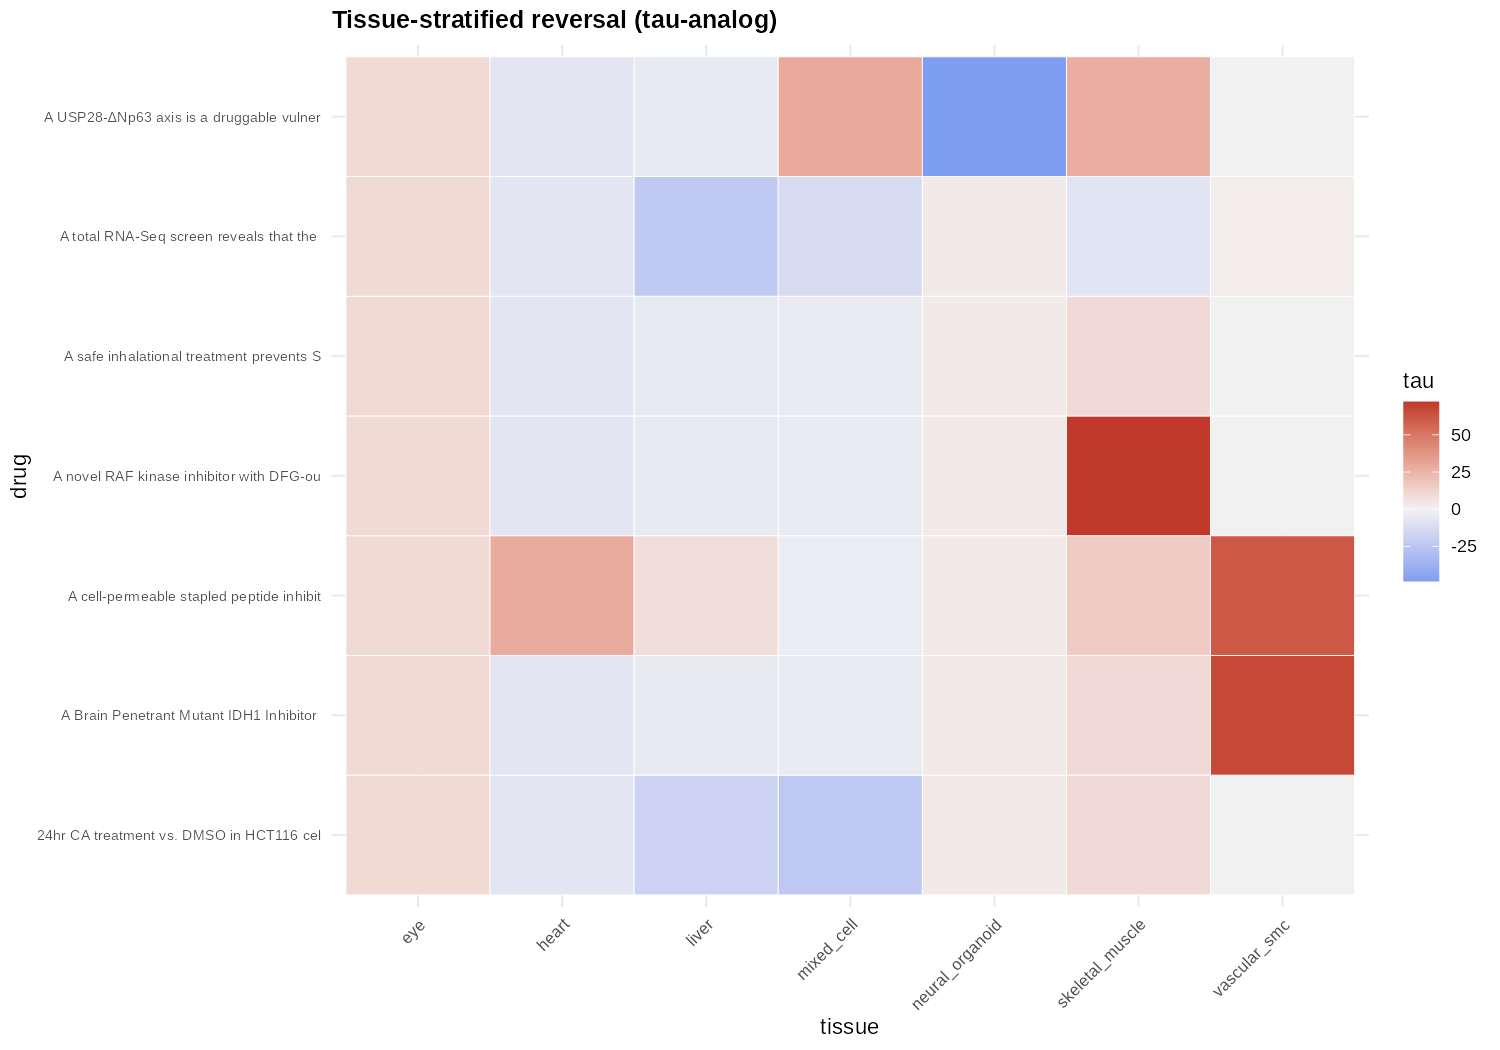
Using a weighted Kolmogorov-Smirnov connectivity score (\(\tau\)-analog normalised against the LINCS L1000 background), we screened 420 drug perturbation signatures for opposite-forcing reversal of the 1,610 oncogenic biomarkers. Twenty-one compounds reached maximal reversal (\(\tau = -100\)), led by food-derived flavonoids, MDM2 inhibitors (Nutlin-3), topoisomerase inhibitors (doxorubicin), and PI3K-mTOR modulators.
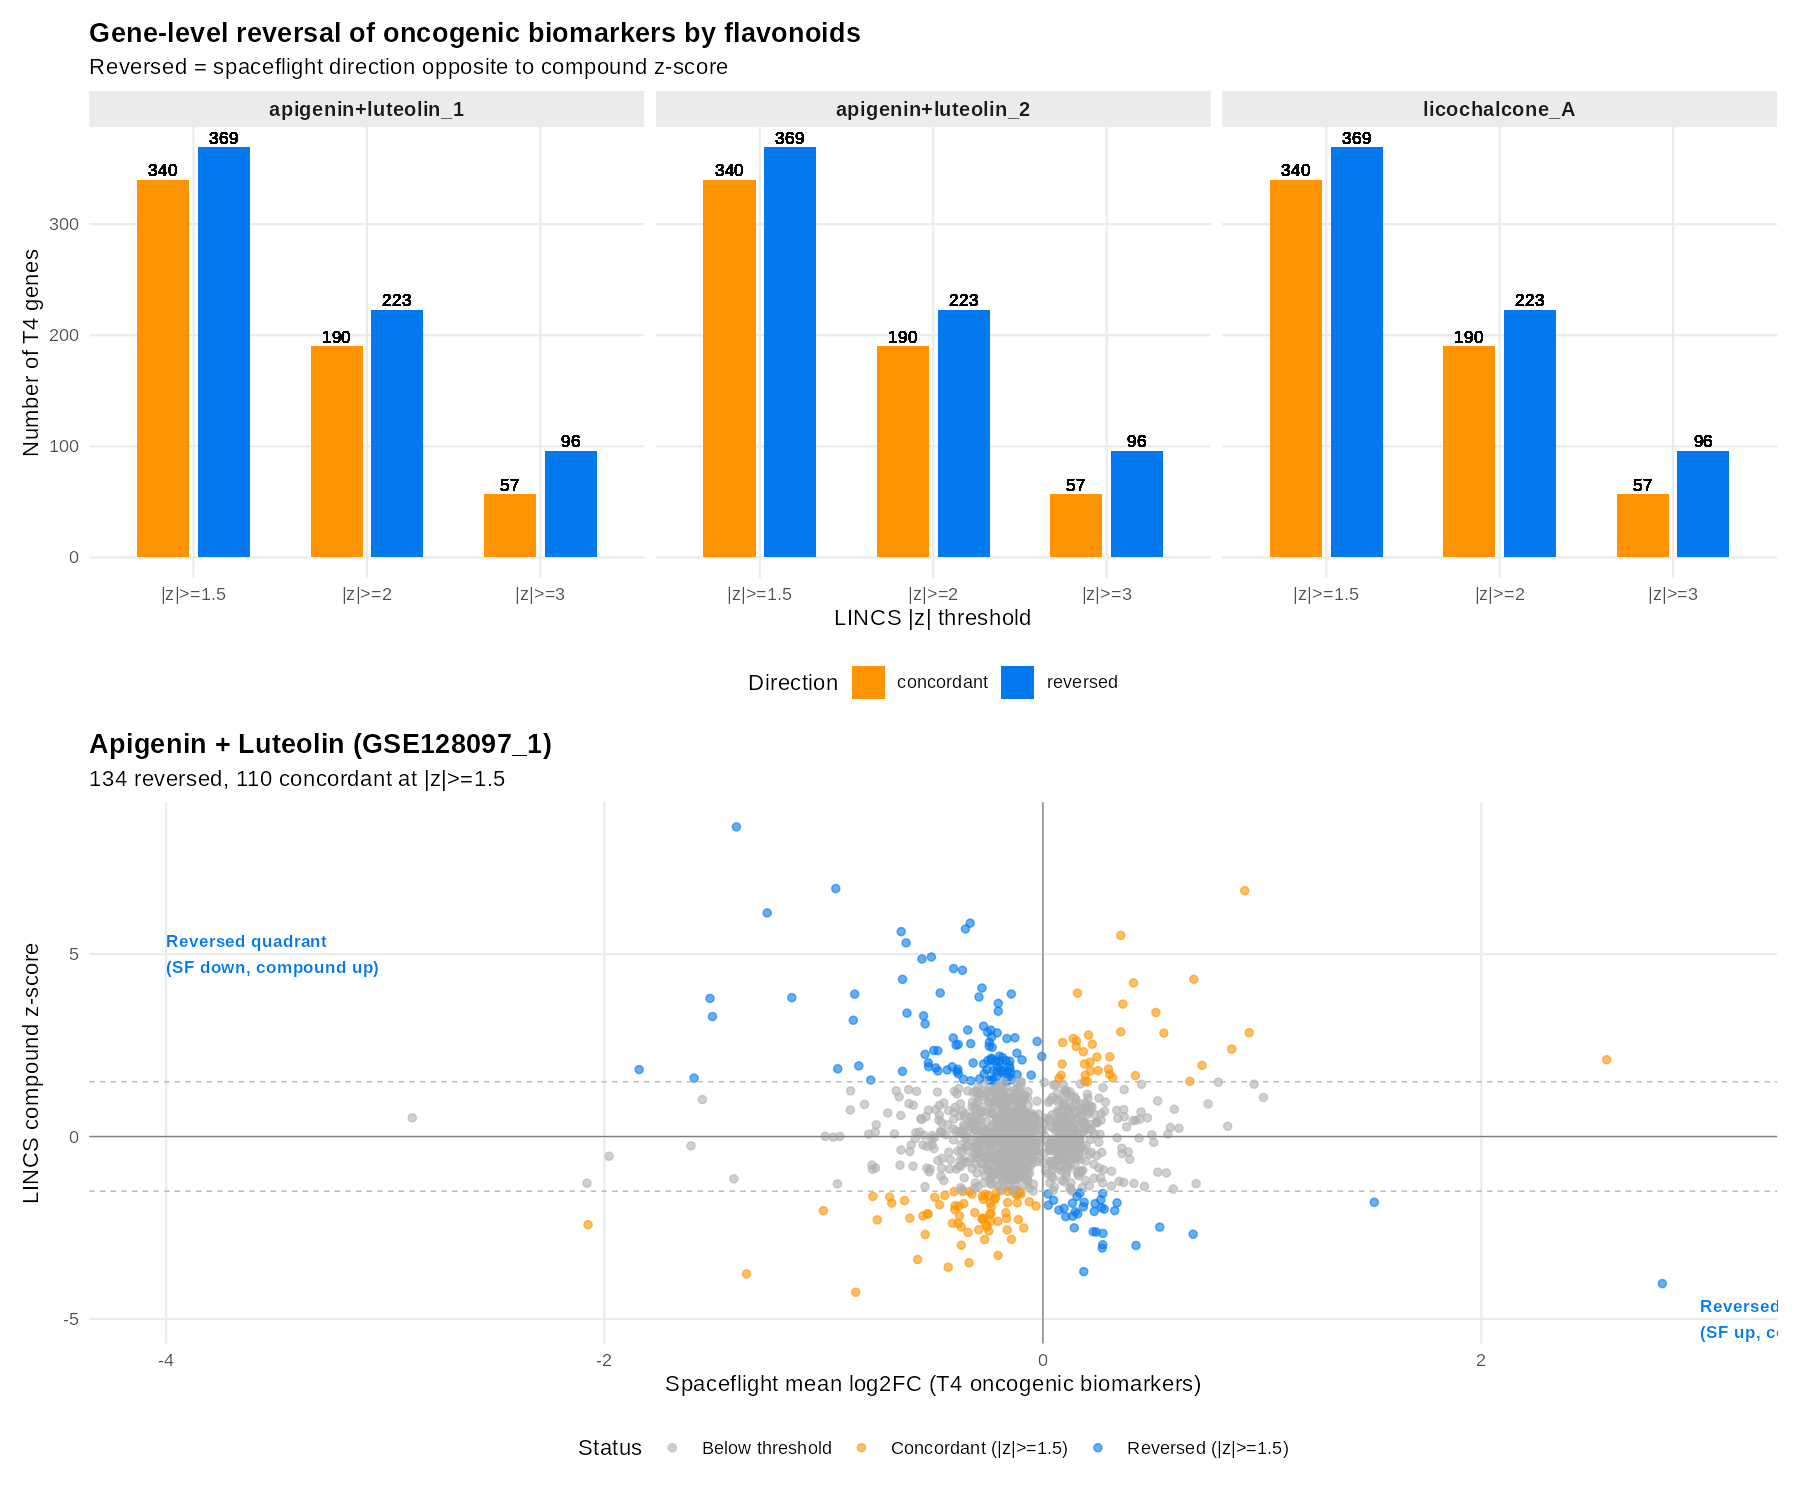
Because apigenin, luteolin, and licochalcone A were among the strongest reversal candidates and are dietary compounds directly relevant to space crew nutritional planning, we dissected their gene-level effects across the 1,540 assessable biomarker genes. A gene was defined as directly reversed when its spaceflight \(\text{log2FC}\) was opposite to its compound \(z\)-score at \(|z| \ge 1.5\).
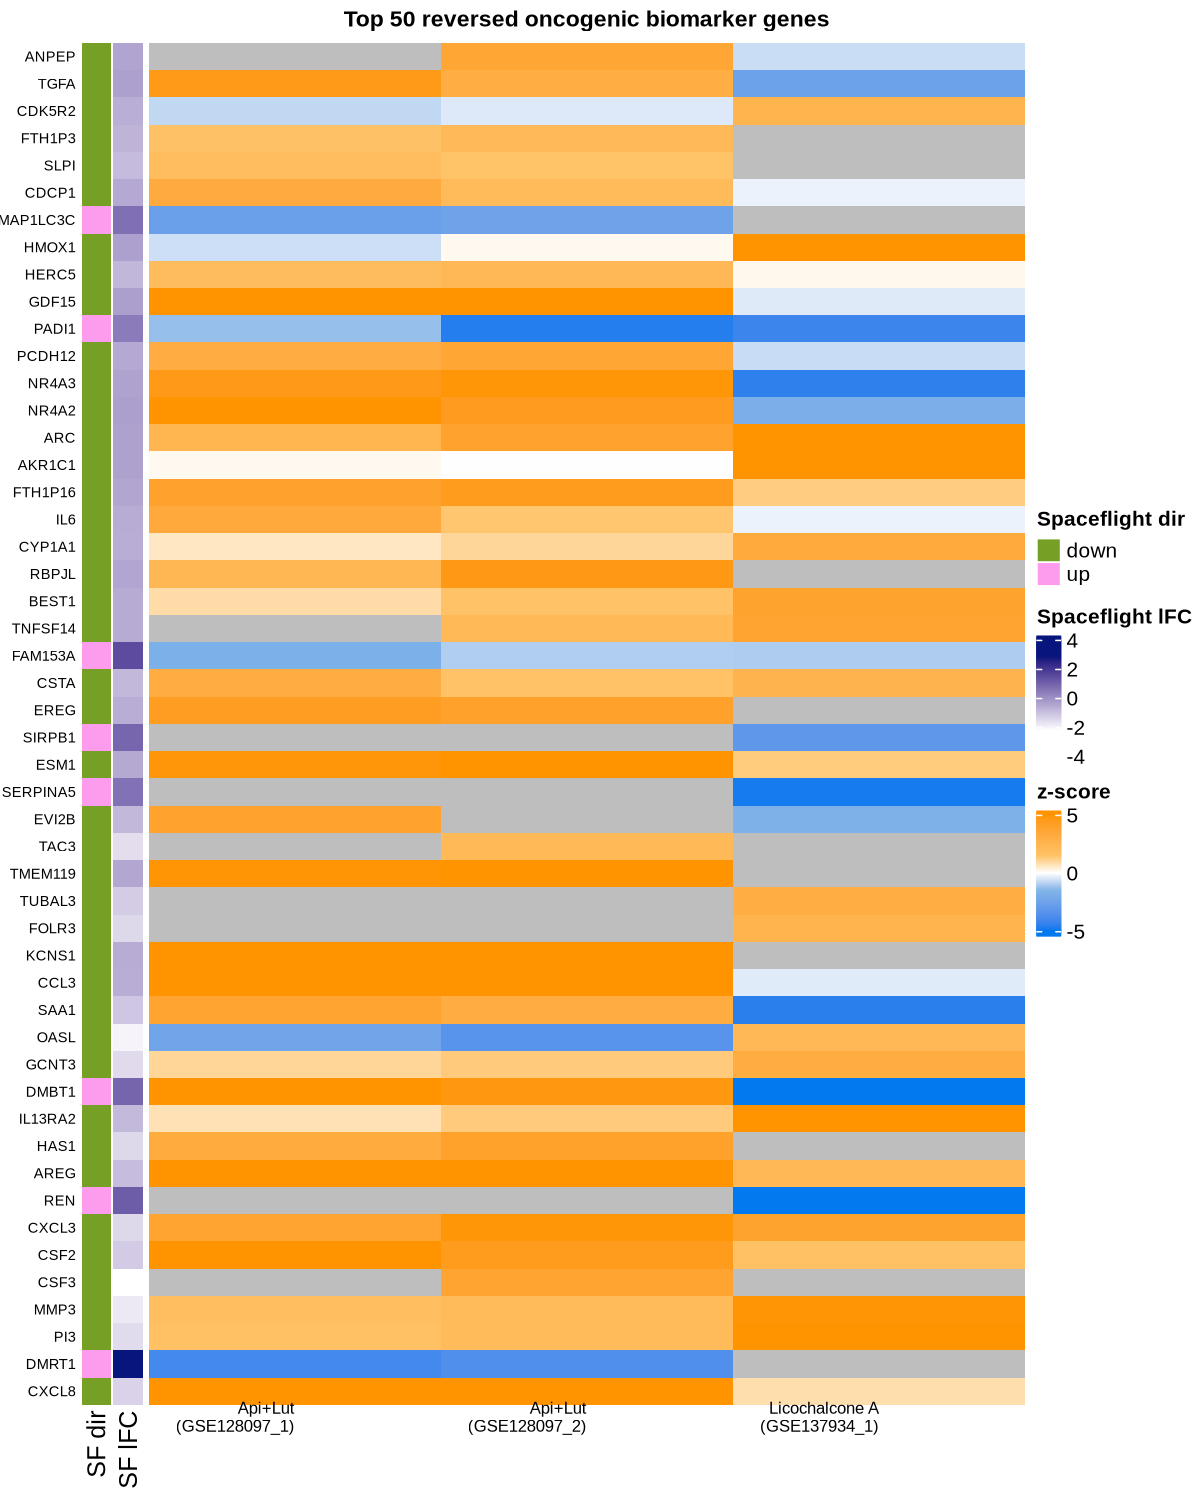
242 unique oncogenic biomarker genes (15.7%) were directly reversed by at least one flavonoid signature, with 20 genes reversed across all three signatures. Strikingly, the top reversed genes are critical inflammatory chemokines and senescence-associated secretory phenotype (SASP) factors down-regulated by spaceflight and restored/up-regulated by flavonoids: CXCL8 (IL-8), MMP3, CSF2 (GM-CSF), CSF3 (G-CSF), CXCL3, AREG, and HAS1.
| Gene Symbol |
Spaceflight Dir |
SF Mean log2FC |
Max Compound |z| |
Signatures Reversed |
Class |
Biological Role |
| CXCL8 |
Down (SF) |
−1.40 |
8.49 |
2 / 3 |
SASP |
Interleukin-8; neutrophil recruitment & immune activation |
| DMRT1 |
Up (SF) |
+2.83 |
4.03 |
2 / 3 |
C6 Oncogenic |
Transcription factor involved in cellular transformation |
| PI3 |
Down (SF) |
−1.59 |
6.37 |
3 / 3 |
C6 Oncogenic |
Peptidase inhibitor 3 / Elafin; mucosal immunity & barrier defence |
| MMP3 |
Down (SF) |
−1.84 |
4.92 |
3 / 3 |
SASP |
Matrix metalloproteinase-3; ECM remodelling & wound healing |
| CSF3 |
Down (SF) |
−2.28 |
3.82 |
1 / 3 |
C6 Oncogenic |
Granulocyte colony-stimulating factor (G-CSF) |
| CSF2 |
Down (SF) |
−1.26 |
6.13 |
3 / 3 |
SASP |
Granulocyte-macrophage CSF (GM-CSF); myeloid differentiation |
| CXCL3 |
Down (SF) |
−1.52 |
4.88 |
3 / 3 |
C6 Oncogenic |
Chemokine ligand 3; monocyte/macrophage migration |
| REN |
Up (SF) |
+1.12 |
6.42 |
1 / 3 |
C6 Oncogenic |
Renin; blood pressure regulation & fluid balance |
| AREG |
Down (SF) |
−0.95 |
6.80 |
3 / 3 |
C6 Oncogenic |
Amphiregulin; EGFR ligand promoting tissue repair |
| HAS1 |
Down (SF) |
−1.51 |
3.98 |
2 / 3 |
C6 Oncogenic |
Hyaluronan synthase-1; extracellular matrix synthesis |
Hypergeometric enrichment against PrimeKG (160,822 disease-gene edges) identified 389 significant disease associations (\(p_{\mathrm{adj}} < 0.05\)), led by sarcomatoid carcinoma (\(p_{\mathrm{adj}} = 3.3 \times 10^{-12}\)), undifferentiated carcinoma, coronary artery disease (\(p_{\mathrm{adj}} = 3.4 \times 10^{-11}\)), and prostate cancer. Open Targets GraphQL API returned 4,891 associations across 1,689 diseases.
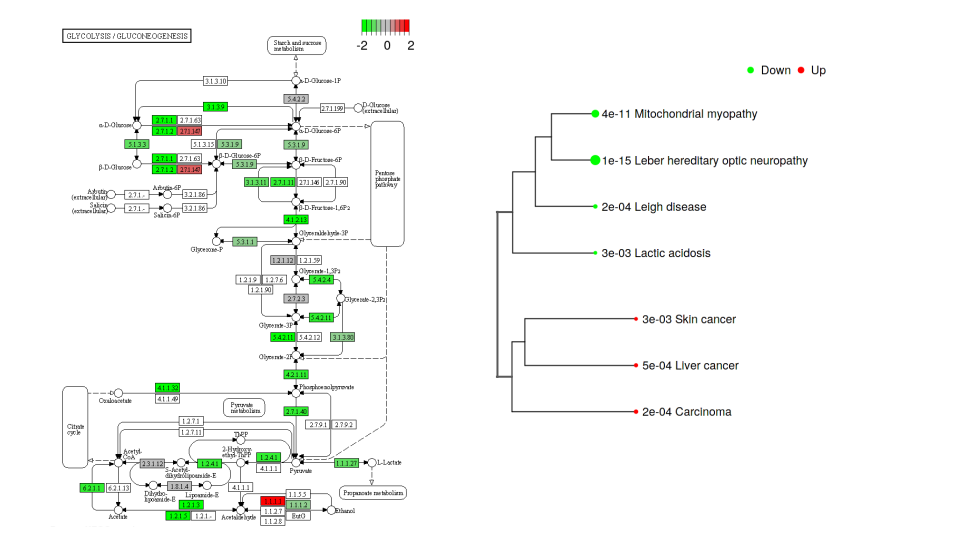
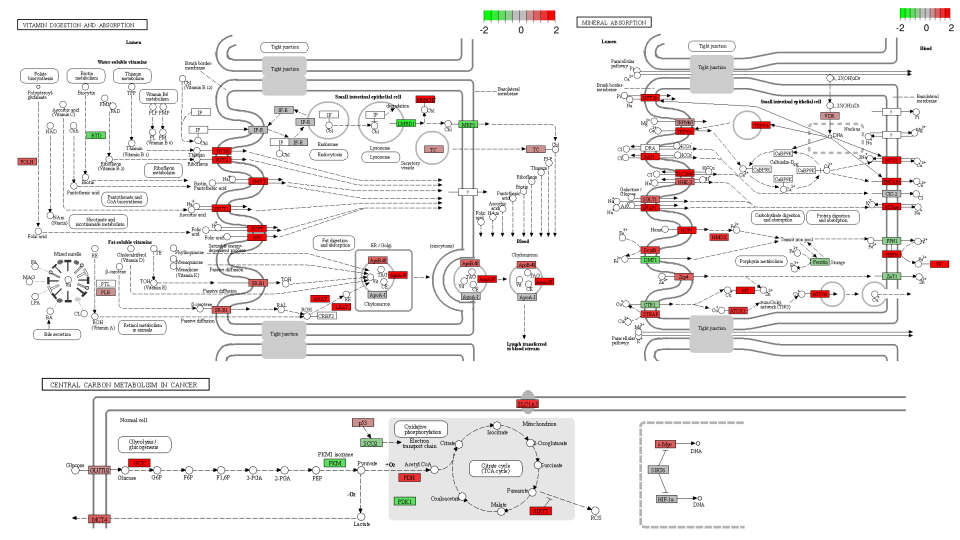
In addition to the 23 OSDR datasets, this repository incorporates whole-blood RNA-seq data from the JAXA6 astronaut mission (flight vs pre-flight and ground control contrasts), analyzed using iDEP and KEGG pathway mapping. The in-vivo astronaut data confirms robust activation of inflammatory and immune counter-regulation networks during long-duration orbital flight.
| Table |
File Name |
Rows |
Description |
Format |
| T3 |
T3_meta_signature.tsv |
40,211 |
Genome-wide random-effects meta-analysis results (mean log2FC, SE, z, padj) |
TSV (4.5 MB) |
| T4 |
T4_oncogene_intersection.csv |
1,610 |
The 1,610 spaceflight oncogenic biomarker genes (meta-significant ∩ oncogene union) |
CSV (150 KB) |
| T5 |
T5_validation_concordance.csv |
5 |
Validation metrics vs independent Python meta-signature S2 (\(\rho = 0.603\)) |
CSV |
| T5b |
T5b_R_vs_S2_joined.csv |
19,484 |
Gene-by-gene comparison between R and Python S2 meta-signatures |
CSV (2.3 MB) |
| T6 |
T6_lincs_reversal_scores.csv |
420 |
LINCS L1000 tau-analog reversal connectivity scores across all drug signatures |
CSV (60 KB) |
| T7 |
T7_top_opposite_forcing.csv |
50 |
Top 50 opposite-forcing candidate compounds (including 21 at \(\tau = -100\)) |
CSV (20 KB) |
| T8 |
T8_tissue_stratified_reversal.csv |
4,620 |
Tissue-stratified reversal scores across 19 tissues and drug signatures |
CSV (730 KB) |
| T9 |
T9_drug_context.csv |
50 |
Drug annotations (clinical phase, MoA, targets from Broad Repurposing Hub & PrimeKG) |
CSV (17 KB) |
| T10b |
T10b_disease_enrichment_combined.csv |
2,898 |
Combined disease ranking integrating PrimeKG and Open Targets |
CSV (330 KB) |
| T11 |
T11_disease_enrichment_opentargets.csv |
1,689 |
Open Targets gene-disease associations |
CSV (180 KB) |
| T12 |
T12_nutraceutical_flags.csv |
11 |
Nutraceutical candidates flagged among top reversal hits |
CSV (3 KB) |
| T12c |
T12c_nutraceutical_full_scan.csv |
37 |
Full scan of all 420 signatures for nutraceutical compounds |
CSV (7 KB) |
| T13 |
T13_gene_level_reversal.csv |
3,895 |
Gene \(\times\) signature reversal comparisons across 3 flavonoid signatures |
CSV (1.1 MB) |
| T13b |
T13b_gene_level_reversal_summary.csv |
3 |
Summary counts and reversal ratios across effect thresholds |
CSV (1 KB) |
| T13c |
T13c_reversed_genes_union.csv |
242 |
Union of 242 unique reversed biomarker genes at \(|z| \ge 1.5\) with per-sig \(z\)-scores |
CSV (25 KB) |
Reproducibility & Pipeline Execution: All analyses were performed in R 4.4.3 with dependencies managed via renv.lock. The full pipeline can be run using Rscript run_all.R or step-by-step using scripts 01_OSD_query.R through 07_gene_level_reversal.R.