Plant Splicing · NASA OSDR
A coordinated multi-study alternative splicing (AS) analysis of plant spaceflight transcriptomes in the NASA Open Science Data Repository: 201 samples from 8 studies (199 samples from 7 Arabidopsis studies, plus 2 samples from 1 Brassica rapa study), spanning microgravity and partial gravity on the ISS, simulated cosmic radiation, and Apollo lunar regolith. All results on this page are from the 7 Arabidopsis studies.
Characterizing post-transcriptional regulation under spaceflight-relevant stresses.
While transcriptional changes in spaceflight have been widely mapped, alternative splicing remains a major frontier. This pipeline leverages rMATS-turbo to quantify alternative splicing events, classifies potential nonsense-mediated decay (NMD) sensitivity with a frameshift heuristic, performs machine learning (UMAP, nested cross-validation, LOSOCV, and SHAP importance), and conducts multi-ontology enrichment analysis (GO, MapMan) to uncover the post-transcriptional footprint of space stress.
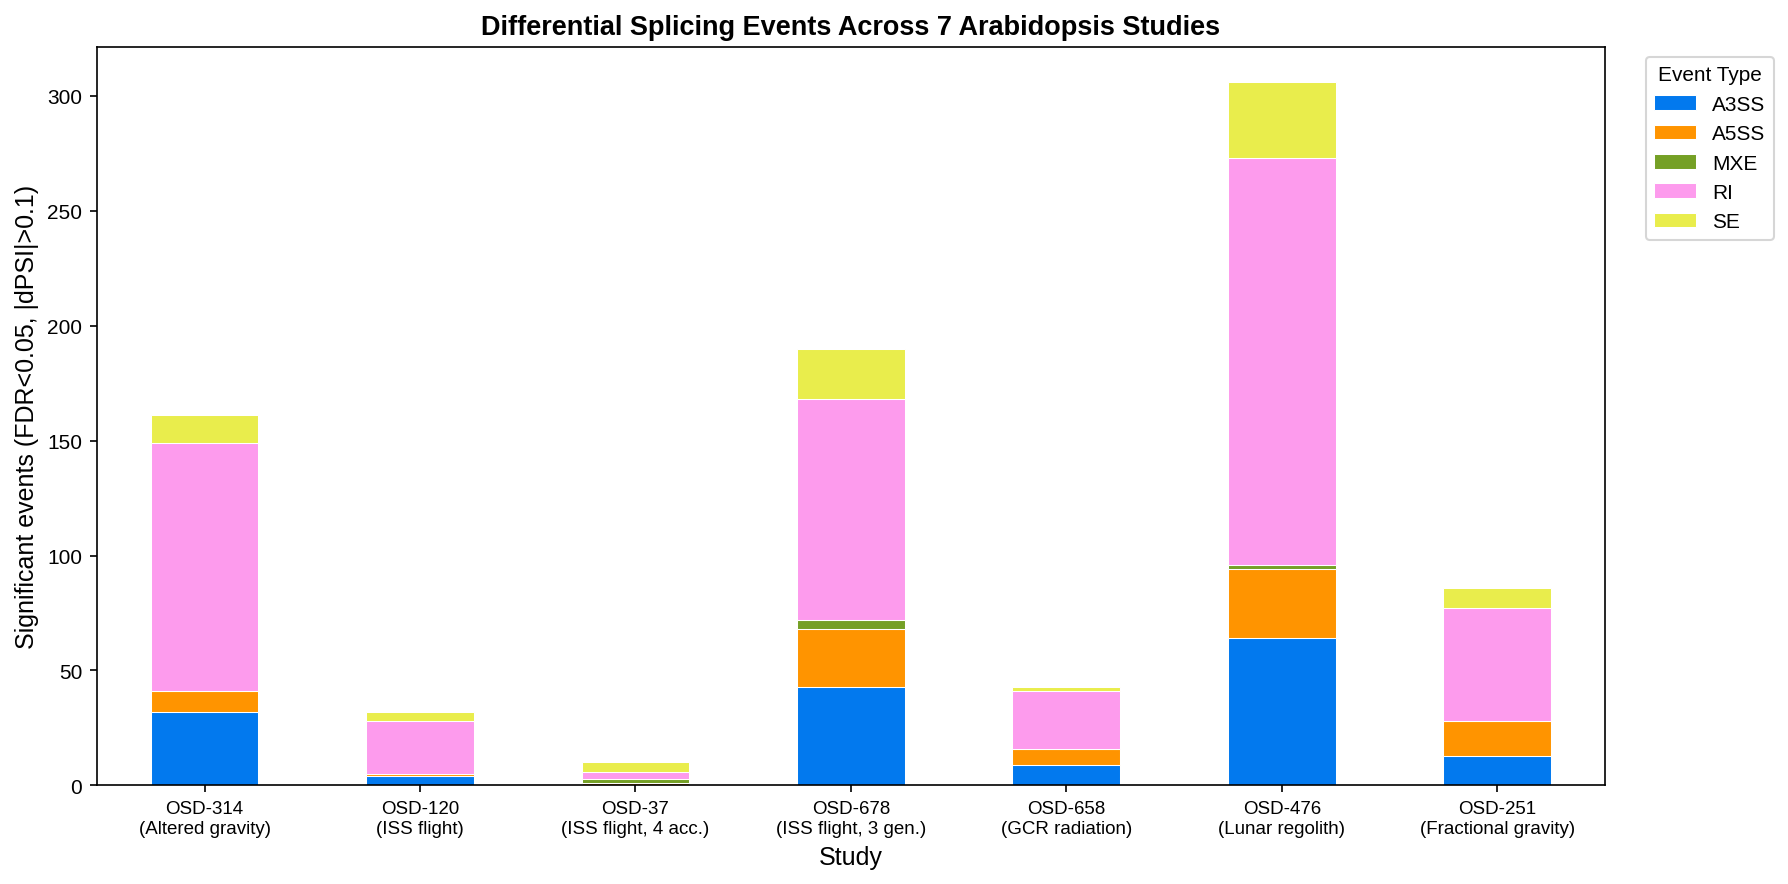
Retained Intron (RI) events are the largest class of significant events in 6 of 7 studies (51–72% of significant events). The exception is OSD-37, where only 10 events were significant (SE 4, RI 3).
Share of significant events classified as potentially NMD-sensitive by a frameshift heuristic that counts every RI event as NMD-sensitive. It mostly reflects the RI share; NMD itself was not measured.
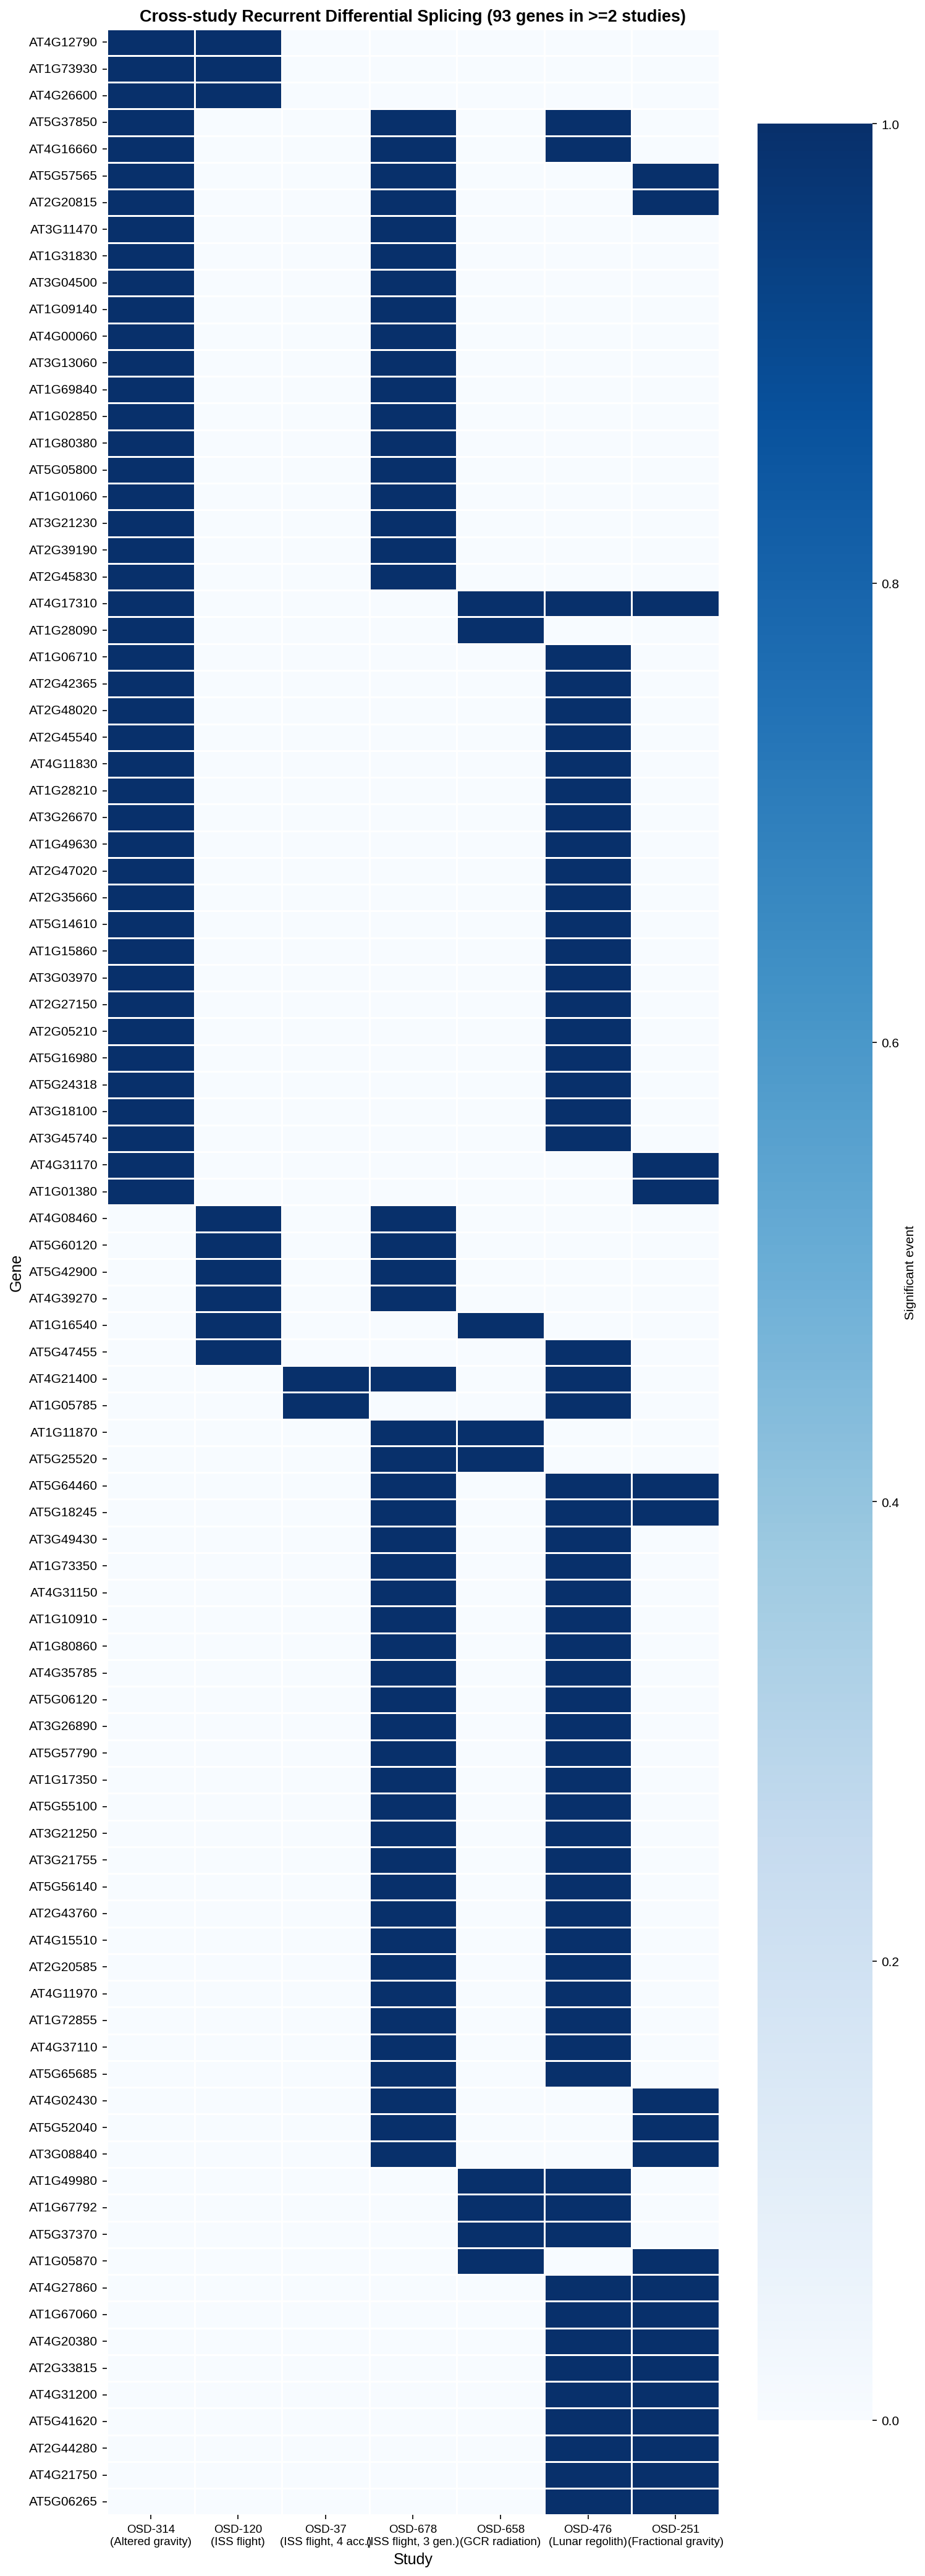
93 genes are significant in 2 or more of the 7 studies (85 in two, 7 in three, 1 in four).
Retained introns are the most frequent class of significant splicing change.
Across spaceflight (ISS), altered gravity, simulated galactic cosmic ray (GCR) radiation, and growth in Apollo lunar regolith, rMATS detected significant splicing changes in every study (10 to 306 events at FDR < 0.05 and |ΔPSI| > 0.1). Retained introns are the largest class of significant events in 6 of the 7 studies. Whether these intron-retention events introduce premature termination codons and trigger NMD was not tested here: the NMD classification is a frameshift heuristic that counts every retained intron as NMD-sensitive.
Recurrence analysis finds genes significant in several studies across gravity, radiation, and lunar substrates.
Comparing significant genes across the 7 Arabidopsis studies identified 93 genes significant in 2 or more studies. The most recurrent is AT4G17310 (an uncharacterized protein in Araport11), significant in 4 of the 7 studies: fractional gravity (OSD-251), altered gravity (OSD-314), lunar regolith (OSD-476) and simulated GCR radiation (OSD-658). Seven further genes are significant in three studies, including SOS4 (AT5G37850, pyridoxal kinase) and CRK28 (AT4G21400, cysteine-rich receptor-like kinase 28).
UMAP and tree-based classification reveal that study-specific batch effects dominate biological signals.
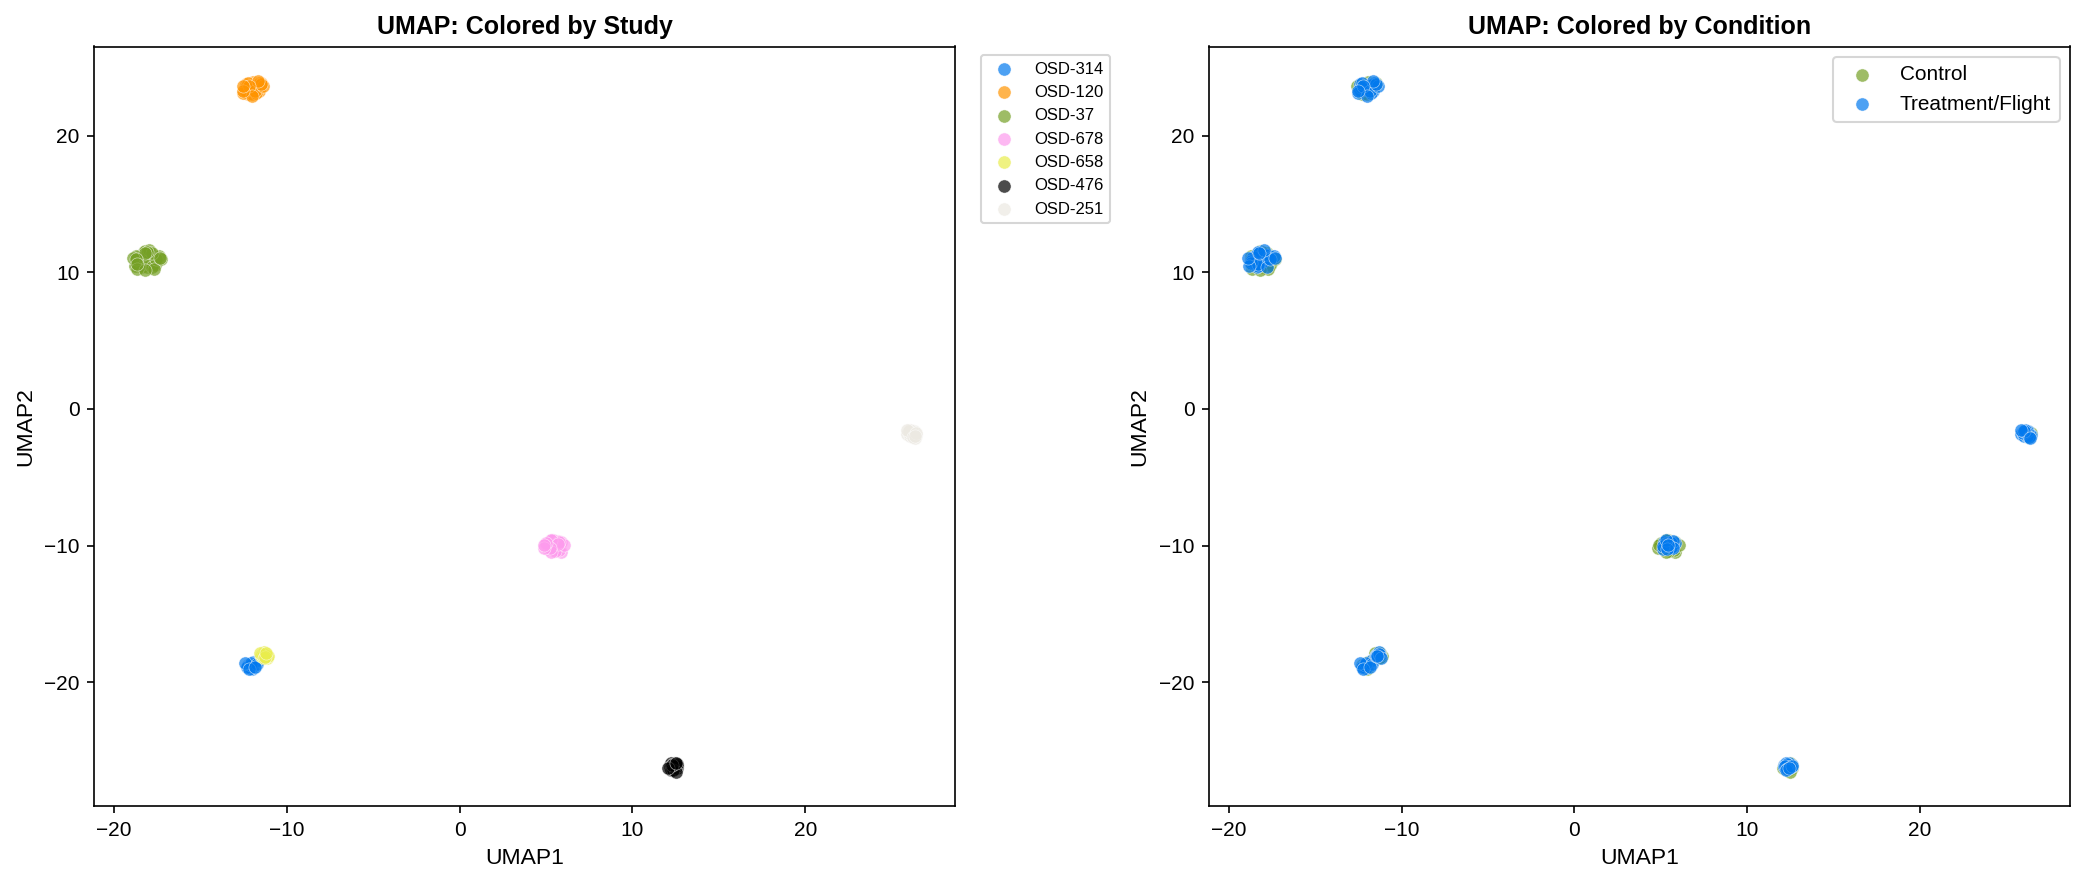
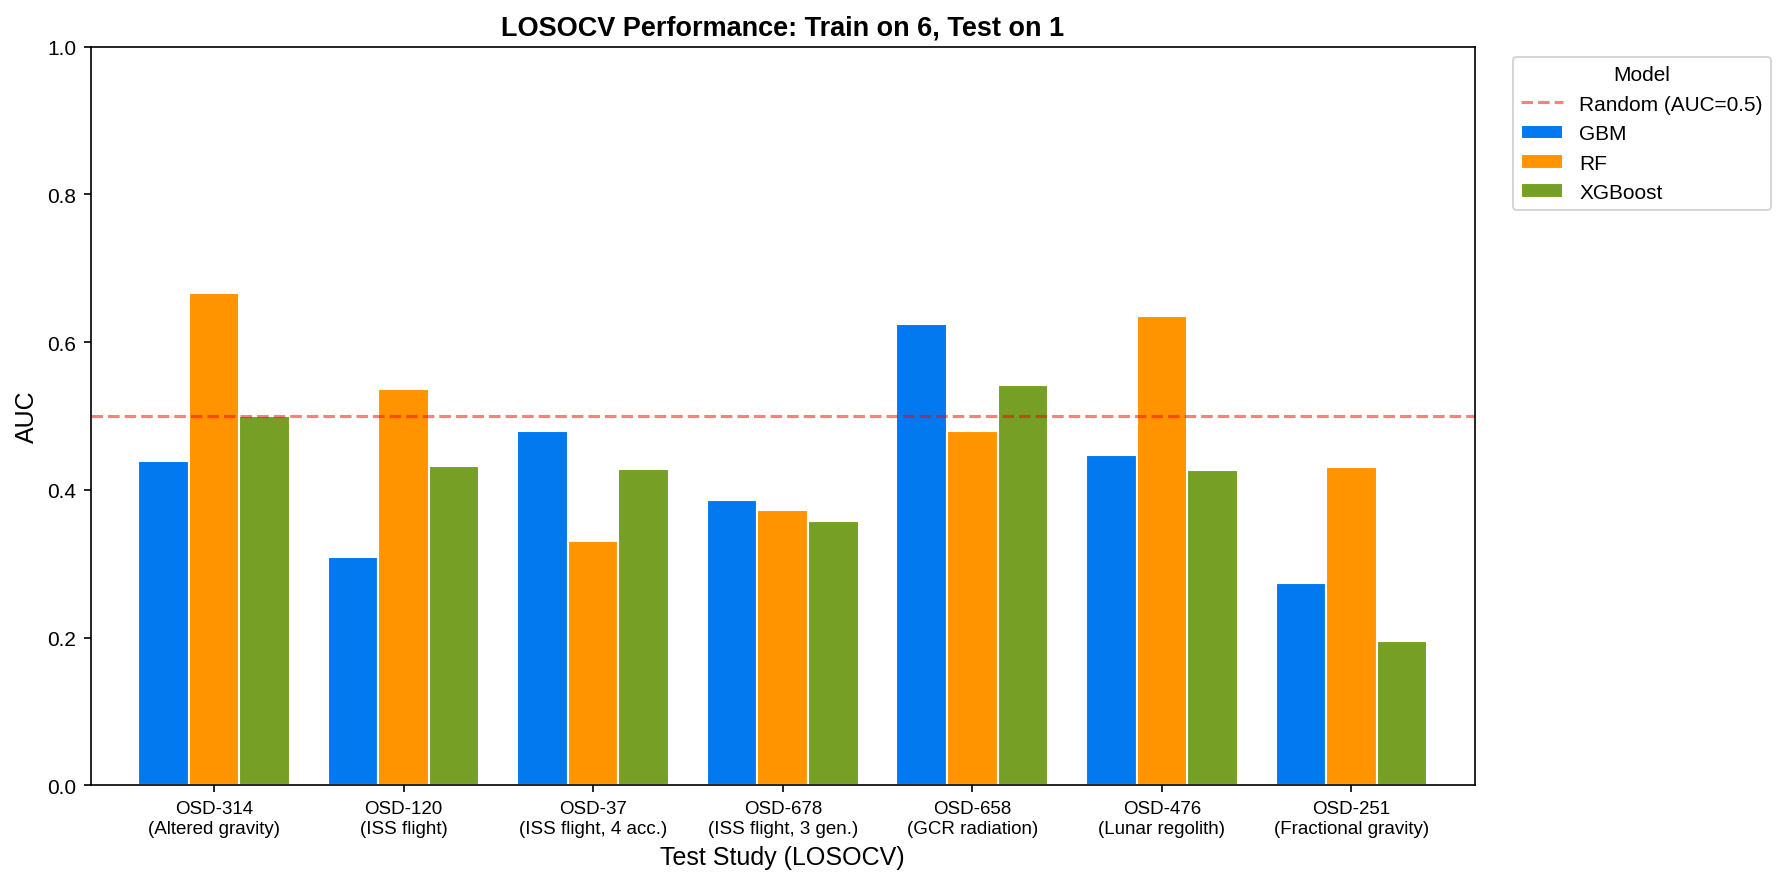
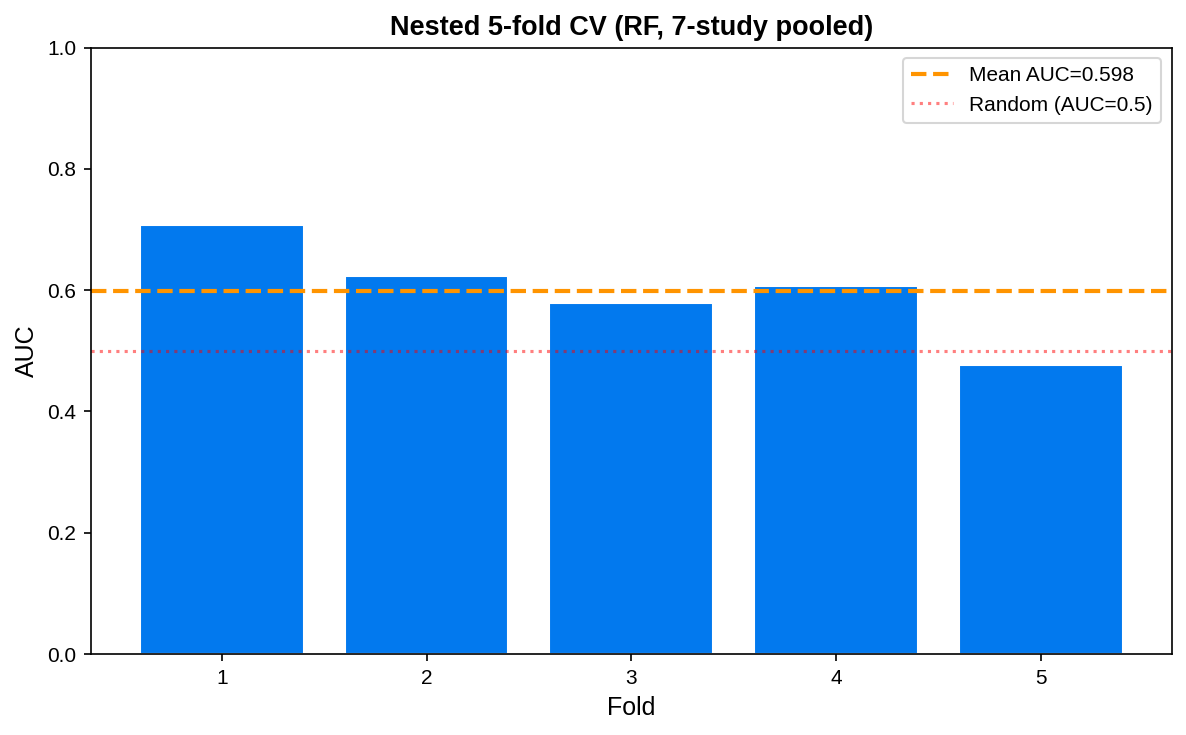
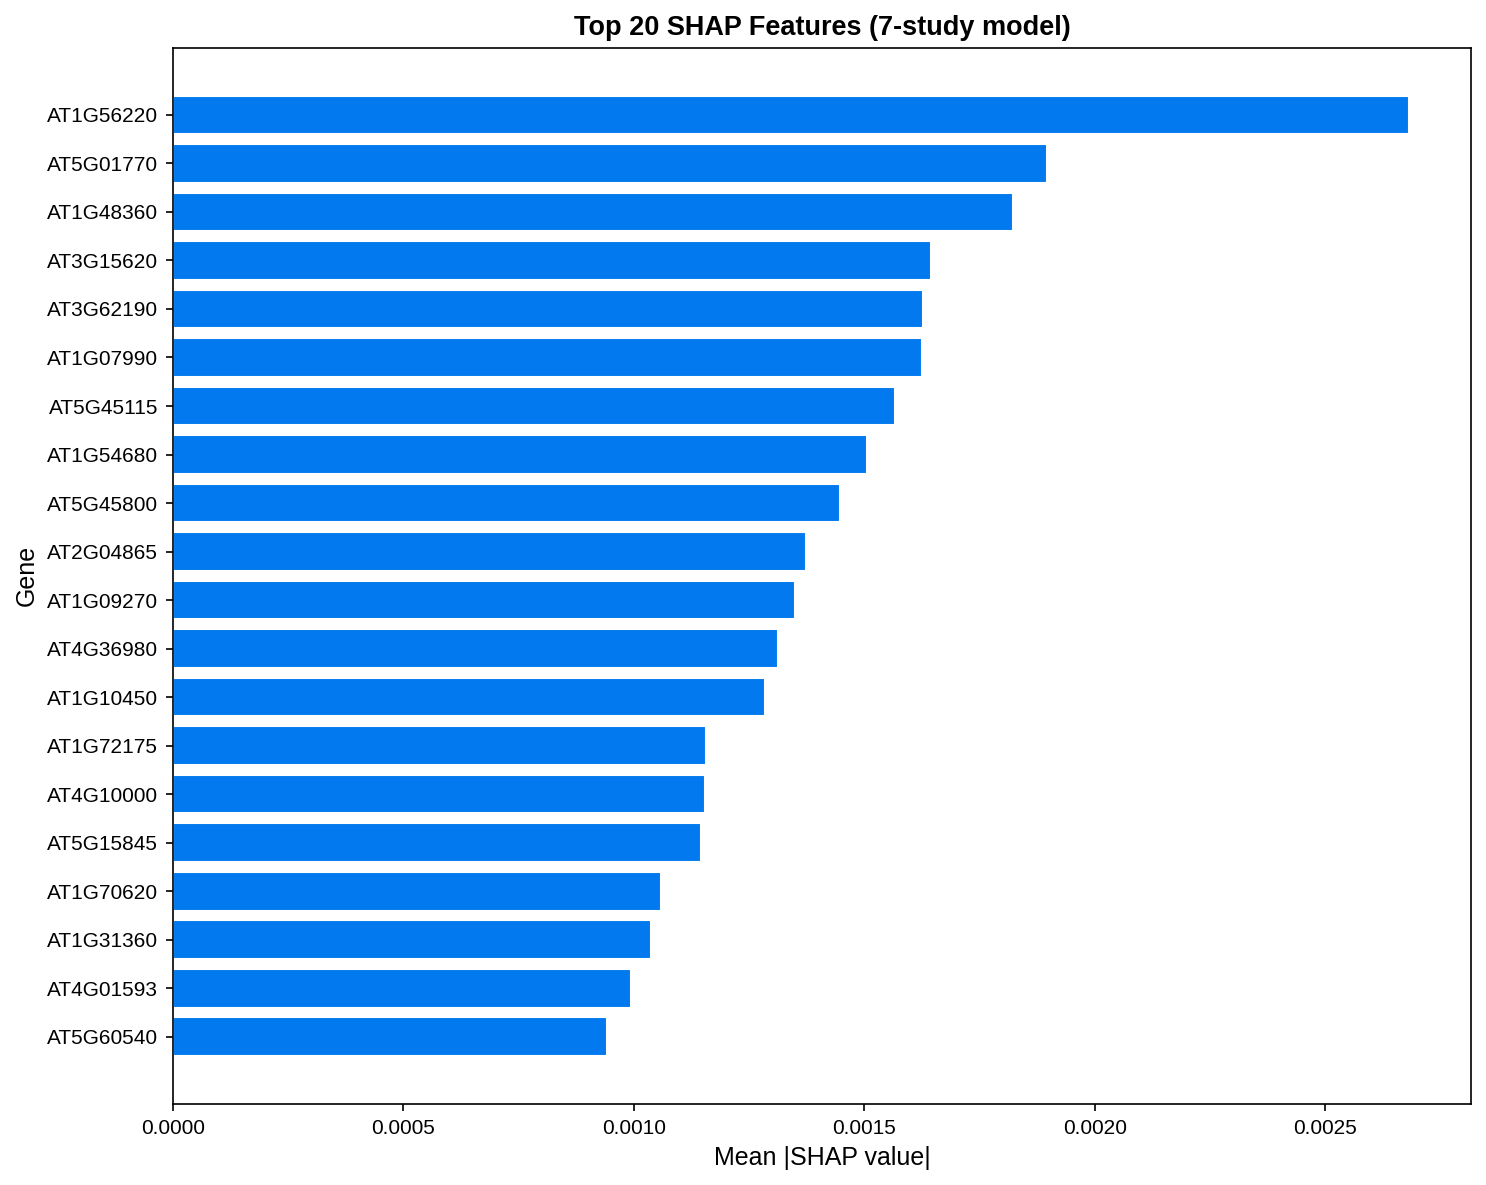
Machine learning classification of the 199-sample × 9,875-gene Percent Spliced In (PSI) matrix achieves a pooled nested 5-fold CV AUC of 0.598 for predicting treatment (stress) versus control. However, 7-study Leave-One-Study-Out Cross-Validation (LOSOCV) performance drops to near or below random (mean AUC across held-out studies: RF 0.49, GBM 0.42, XGBoost 0.41), showing poor cross-study generalization. Unsupervised UMAP embedding reveals that samples cluster almost perfectly by study identity (ARI = 0.995) rather than by treatment status (ARI = -0.002). This represents a critical methodological finding: batch effects overwhelmingly dominate the alternative splicing landscape in public space omics.
Circadian-related GO terms recur in four flight datasets, while other stressors show distinct enrichments.
GO over-representation of the genes with significant splicing changes (terms with FDR < 0.25 unless stated):
Exploring reconstructed splice graphs and junction-level splicing metrics.
Splice graph models were reconstructed for the top differentially spliced loci. Use the interactive explorer below to select a study, browse key differentially spliced genes, inspect splicing patterns in vector (SVG) or raster (PNG) formats, and zoom/pan to view specific exon junctions: