Access data in the OSDR
Searching for data within the OSDR
.png)
If you are on the NASA OSDR home page click on the “Data & Tools” tab at the top of the page and then click on the Data Repository link. Or click on the “Data Repository Explore” button.
.png)
The Open Science Data Repository search interface allows users to search, filter, and view search results, including titles, organisms, factors, descriptions, and experiment details. (1) This interface can be launched from the "Data & tools" search. (2) Search datasets, (3) select the number of studies on the page, (4). The Sort by options are set to release date and are highlighted red. (5) The General search Filter table . (6) The icon depicting the model organism is a link to more data about the study. (7) The title is a link to more data about the study.
Search for studies by entering text into the “Search Datasets” box.
On the right you’ll see the number of items per page, the default is 25, but this number can be increased to 50 or 100.
These lists are sorted based on “Release Date” as default, but can be adjusted to reflect “Relevance”, “study accession ID” # or the “Study title”.
On the left of the webpage, you will see some filters to help you identify related studies, select any combination of study features by ‘checking the boxes’ and this will change the number of studies being shown on the screen.
Each study is summarized by an image representing the model organism being investigated, the study title, organism, factors being investigated, assay types, release date, a description and a “Highlights”/ summary.
Clicking on either the image of the model organism or the title will open that study database and present the related metadata, primary data and if available processed data.
Filtering through studies using the metadata user interface
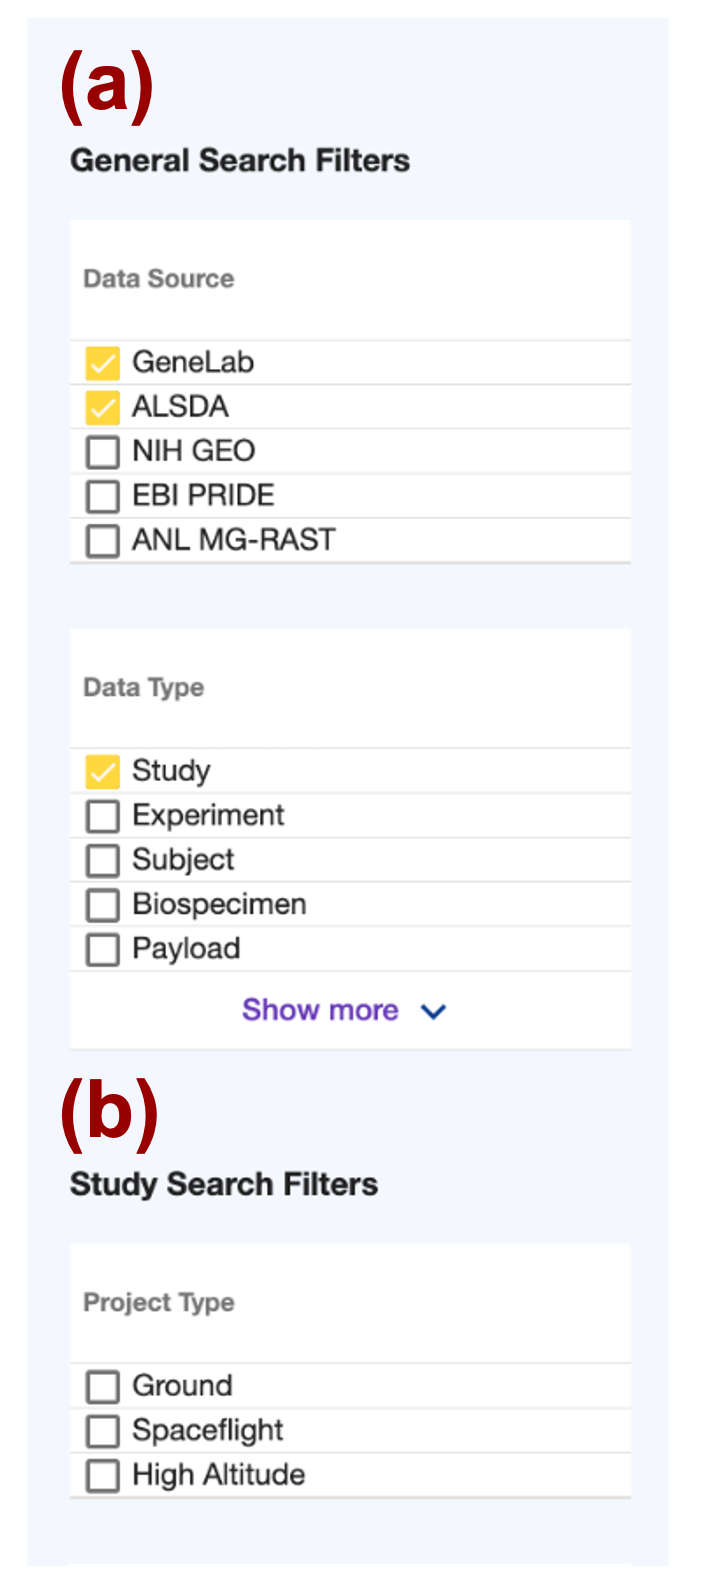
Section A, titled "General Search Filters," provides options for filtering data sources (GeneLab, ALSDA, NIH GEO, EBI PRIDE, and ANL MG-RAST) and data types (Study, Experiment, Subject, Biospecimen, and Payload). It also includes a "Show more" button. Section B, titled "Study Search Filters," offers project-type options for filtering studies, including Ground, Spaceflight, and High Altitude. The GeneLab, ASLSDA and Study data options have been selected and the boxes next to them are orange.
(a)“General Search Filters”
Data Source such as GeneLab, ASLSDA, NHI, EBI PRIDE or MG-RAST
Data Type such as Study, Experiment, Subject, Payload or Biospecimen.
(b)“Study Search Filters”
Project Type such as spaceflight or ground
Assay type such as RNAseq or Proteoimics.
Organism such as human or mouse.
Tissue such as muscle or leaves
Factor such as space flight or ionizing radiation.
Search Bar
The search bar is a quick and easy way to filter through the data and can be used to create precise database queries.
OSDR provides users with a full-text search capability of the metadata for all datasets.
Full-text search terms can be a single word or multiple words with either Boolean, wildcards (asterisks *), or string (text).
Searches are case-insensitive concerning search term(s). To perform a search, enter a keyword or set of keywords, in the search box and either press ‘Enter’ or use your mouse to select the magnifying glass icon.
Search bar example: Search results can be sorted by relevance, release date, source, and title in ascending or descending orders. In addition, to see an overview of the study metadata, click on the image of a magnifying glass, (highlighted with a red dashed square) to show highlighted keyword search relevance.
Clicking on a study title will show all the detailed metadata for that study and provide further data and links or use the page navigator arrow(s) on the top right corner to go to the next page of search results.
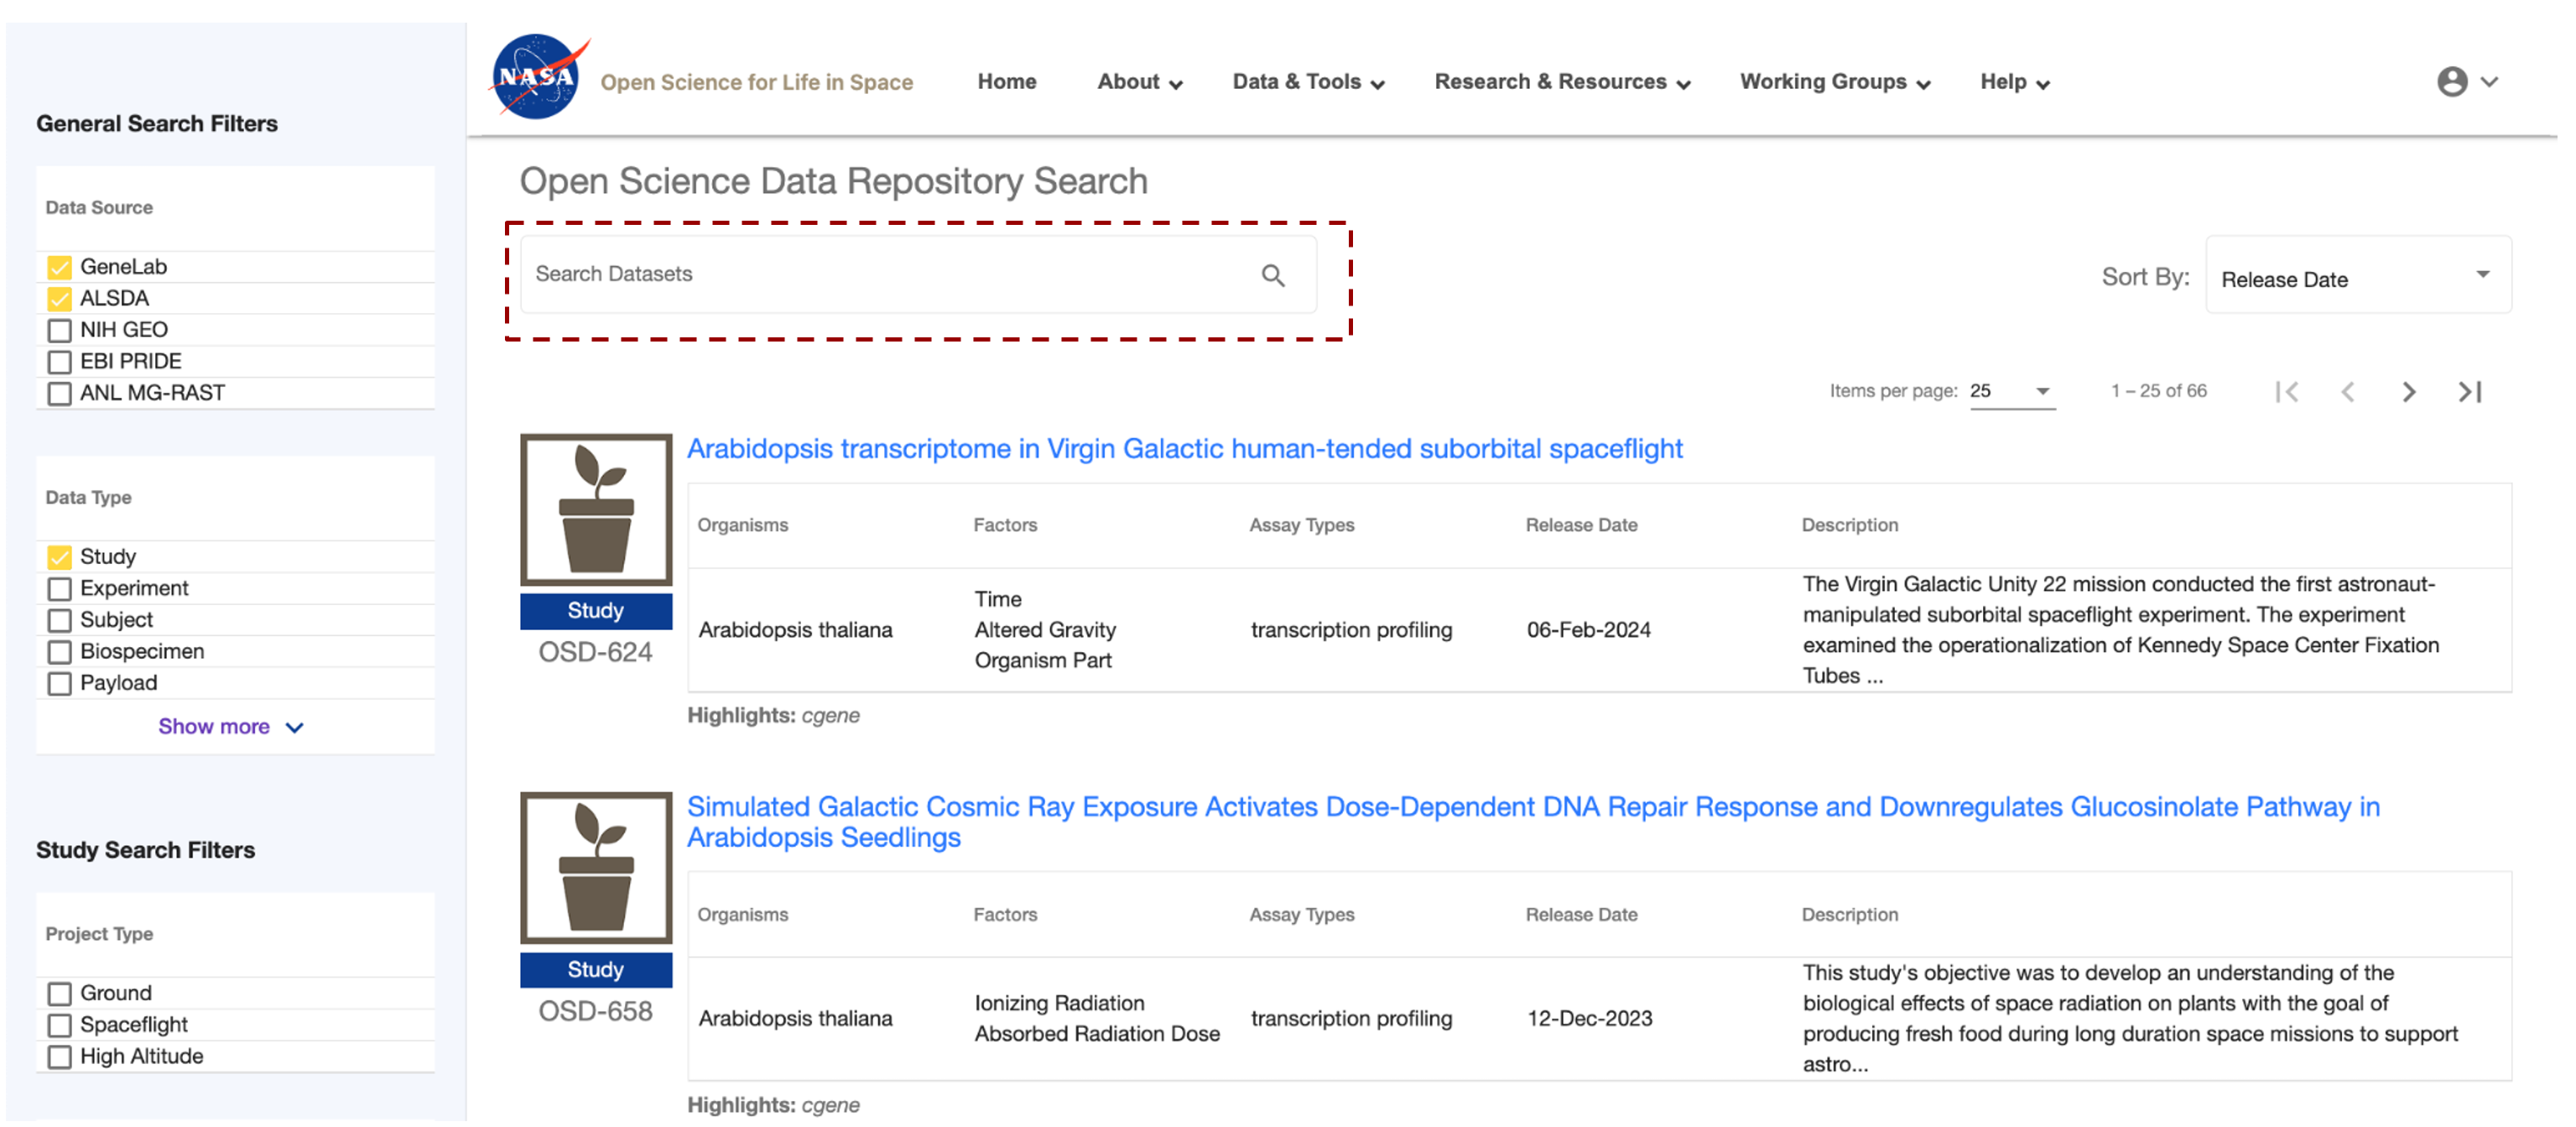
The NASA logo, website navigation menu, and page title are displayed in the header section. The left-hand side of the webpage contains the filters mentioned previously. In the center of the page, the “Search Datasets” box has been highlighted.
Single-word search
Below are some examples of searches.
Single-term search: These are quick and easy and usually create long lists of loosely connected studies.
Single-term example: Search results from searching the single term ‘genome’
Multi-word search
Choosing two or more keywords can quickly identify studies related to your area of interest.
Search results will contain all the search terms and in this example, filter down to 14 OSDR accessions.
Duel-word example: Search results from searching on multiple terms ‘genome ecotype’
.png)
The NASA logo, website navigation menu, and page title are displayed in the header section. The left-hand side of the webpage contains the filters mentioned previously. In the center of the page the “Search Datasets” box has been highlighted, and the term “genome ecotype” has been entered. This search identifies 14 studies that use these terms in their metadata.
Multiple-field searches
How to create efficient searches by searching multiple fields.
Multiple-term search: Search in multiple files such as general search filters, study search filters and keywords or phrases can be used to create concise lists of related studies.
Multiple-term search example: Search results from multiple-term search combined with an additional selection of “Spaceflight” specific “Project type” are shown below.
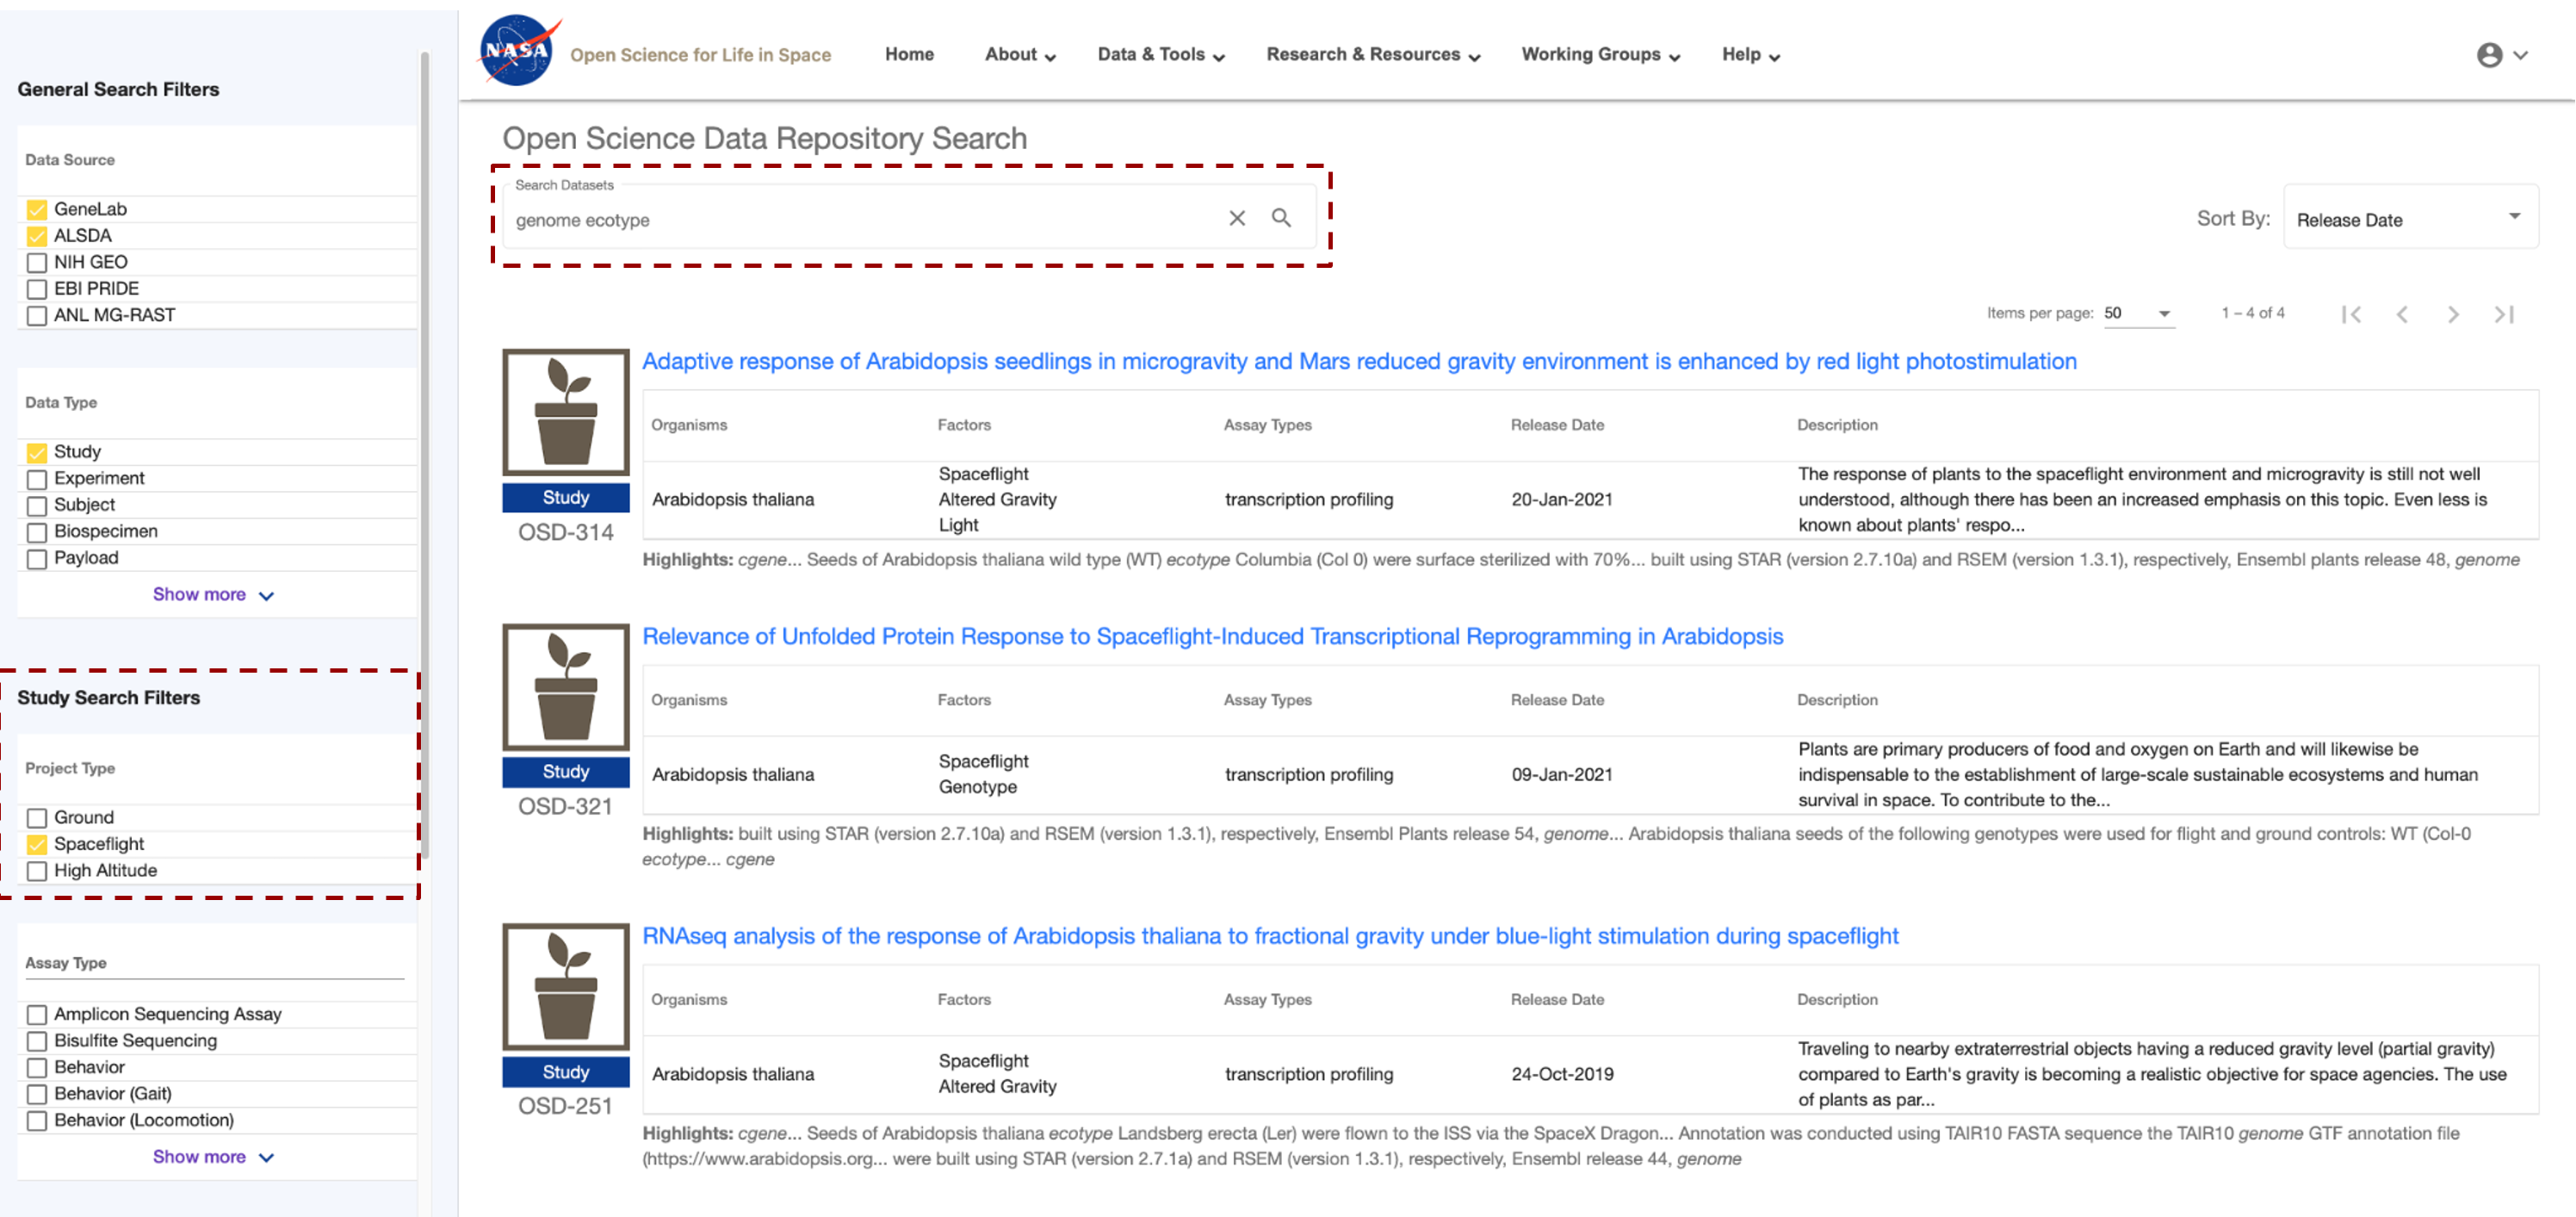
The left-hand side of the webpage contains the filters mentioned previously. In the center of the page the “Search Datasets” box has been highlighted, and the term “genome ecotype” has been entered. In addition, the “Space flight” has been selected as a factor and is highlighted with a red box. This search identifies 4 studies that use these terms in their metadata but only the first 3 are shown.
Boolean Operator Options
How to make your search more insightful or precise using defined boolean operators.
Please note that you may not use both the Boolean operators and double quotations together.
The resulting set is the same as searching for the terms ‘genome’ and ‘ecotype without the operator.
| Operator | |
| AND | ALL search terms must be present (default Boolean search) |
| OR | ANY of your search terms can be present |
| NOT | Exclude words from your search |
Double Quotation marks define search phrases as essential for a precise match requirement.
If multiple words are in double quotations, then those words must match exactly in the order given, as shown below:
Quotation example: Search results from searching the exact term “genome ecotype” by using quotation marks. In this example, no search results were due to a combination of keywords and Boolean operators that failed to match any sample in the database.
.png)
The left-hand side of the webpage contains the "genotype ecotype" search results. In the center of the page the “Search Datasets” box has been highlighted, and the term “genome ecotype” has been entered, this time in quotation marks. This search resulted in no matches being found.
Boolean NOT operator.
Refining search techniques to identify related studies.
Exclude studies containing the term(s) from your search using the minus prefix (-). This is the same as using the NOT operator which is the same as using the NOT operator.
Not operator example: Below is a search using the ‘NOT’ operator. genome ecotype –genotype.
.png)
The left-hand side of the webpage contains the "genoe ecotype - genotypes" search results. In the center of the page the “Search Datasets” box has been highlighted, and the terms “genome ecotype - genotypes” are highlighted to show how Not operators can be used to adjust the search results.
Boolean AND operator.
How to use AND operators to make your search more precise.
Require term(s) in your search using the plus prefix (+). This is the same as using the AND operator.
An operator example: genome sequencing +WS ecotype
.png)
The left-hand side of the webpage contains the filters mentioned previously. In the center of the page the “Search Datasets” box has been highlighted, and the terms “genome ecotype + WS ecotype” are highlighted to show how AND operators can be used to adjust the search results.
Boolean * wild card operator.
How to use a * wild card to find closely related studies.
Search on unspecified portions of the search terms using an asterisk (*)
A *wild card Boolean operator example: genome ecotype * Gravity. In this example, we identified 2 studies with samples that received variable quantities of gravity as a study factor.
.png)
The left-hand side of the webpage contains filters with a Booealn wild card operator being used to define the gravity level. In the center of the page the “Search Datasets” box has been highlighted, and the terms “genome ecotype + * Gravity” is highlighted to show how unspecified “wild card” operators can be used to adjust the search result.
Federating data sources
How to add an external database to your search.
OSDA has integrated, commonly termed a data federation, with multiple heterogeneous external databases. Users can search across multiple databases in addition to OSDA. The links in the federated search results are to the authoritative external databases.
OSDA is currently federated with:
The National Institutes of Health (NIH) Gene Expression Omnibus (GEO)
The European Bioinformatics Institute (EBI) Proteomics Identification (PRIDE)
The OSDA repository does not contain copies of the data sets found in the external databases, GeneLab maintains metadata records (e.g., information about the data) of the external data sets in federated databases. These records are automatically updated to keep the GeneLab database search content up to date with the external databases.
To search in one or all of these databases, enter text search term(s) and select the desired databases as shown below. Federated search results are then shown. You may change the database selection(s) at any time and the search results will be updated accordingly.
In addition to searching the GeneLab Data Repository, federated data repositories can be included in the search.
Example: Below are examples of federated data repositories that can be searched.
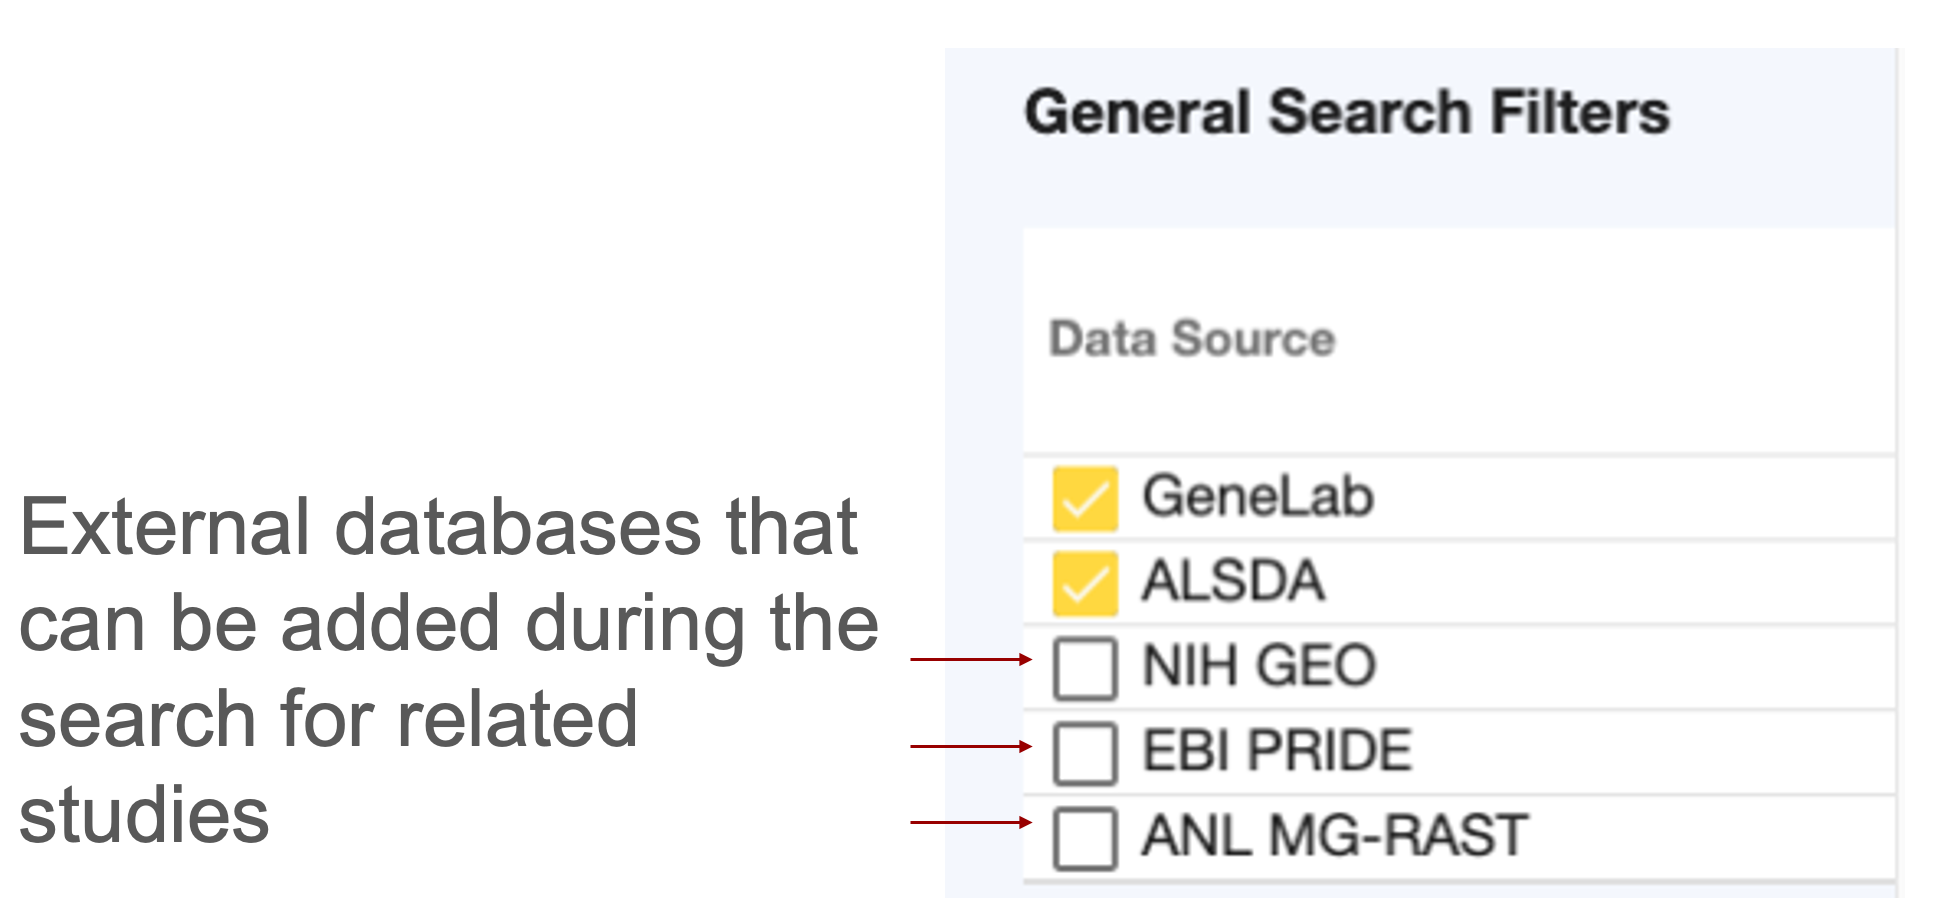
The user can select specific databases to be included in the general search filters. If the user does not have a specific database in mind GeneLab and ALSDA are automatically selected, these options can be left on or turned off or they can also add NIH GEO, EBI PRIDE and AML MG-RAST to search.
Study Search Filters
The filter box on the left can filter through the OSDR to find studies related to your expertise or interests.
In addition, OSDR offers filters that facilitate the search process for related studies within the GeneLab repository. These filters encompass Project Type, Factors, Organisms, and Assay Types. The menu associated with each category contains pre-populated terms derived from datasets included in the OSDR repository. It is noteworthy that the use of these filters is possible without the inclusion of any additional search terms.
After filter selection, the filter is immediately applied, potentially altering the number of search results displayed. Filter values are shown as text above the results as they are added. Multiple options from the same filter allow users to select more closely related studies.
For instance, to filter your search, choose ‘Spaceflight’ from the ‘Factors’ menu, followed by ‘RNA sequencing (RNA-seq)’ and ‘Seedlings’ from the ‘Tissue’ menu. OSDR will search for studies that have either of these terms as factors.
Users can change the filter terms they have selected by selecting the filter again from the drop-down menu or by clicking the “Clear” button. It is important to note that the “Clear” button only eliminates the filter conditions and does not erase any text search terms entered before the filters. In addition to keyword searches in the OSDA, users can also search using key factors from the metadata of the studies.
Example: Below is an example set of filters that can be used to identify studies with similar experimental designs.
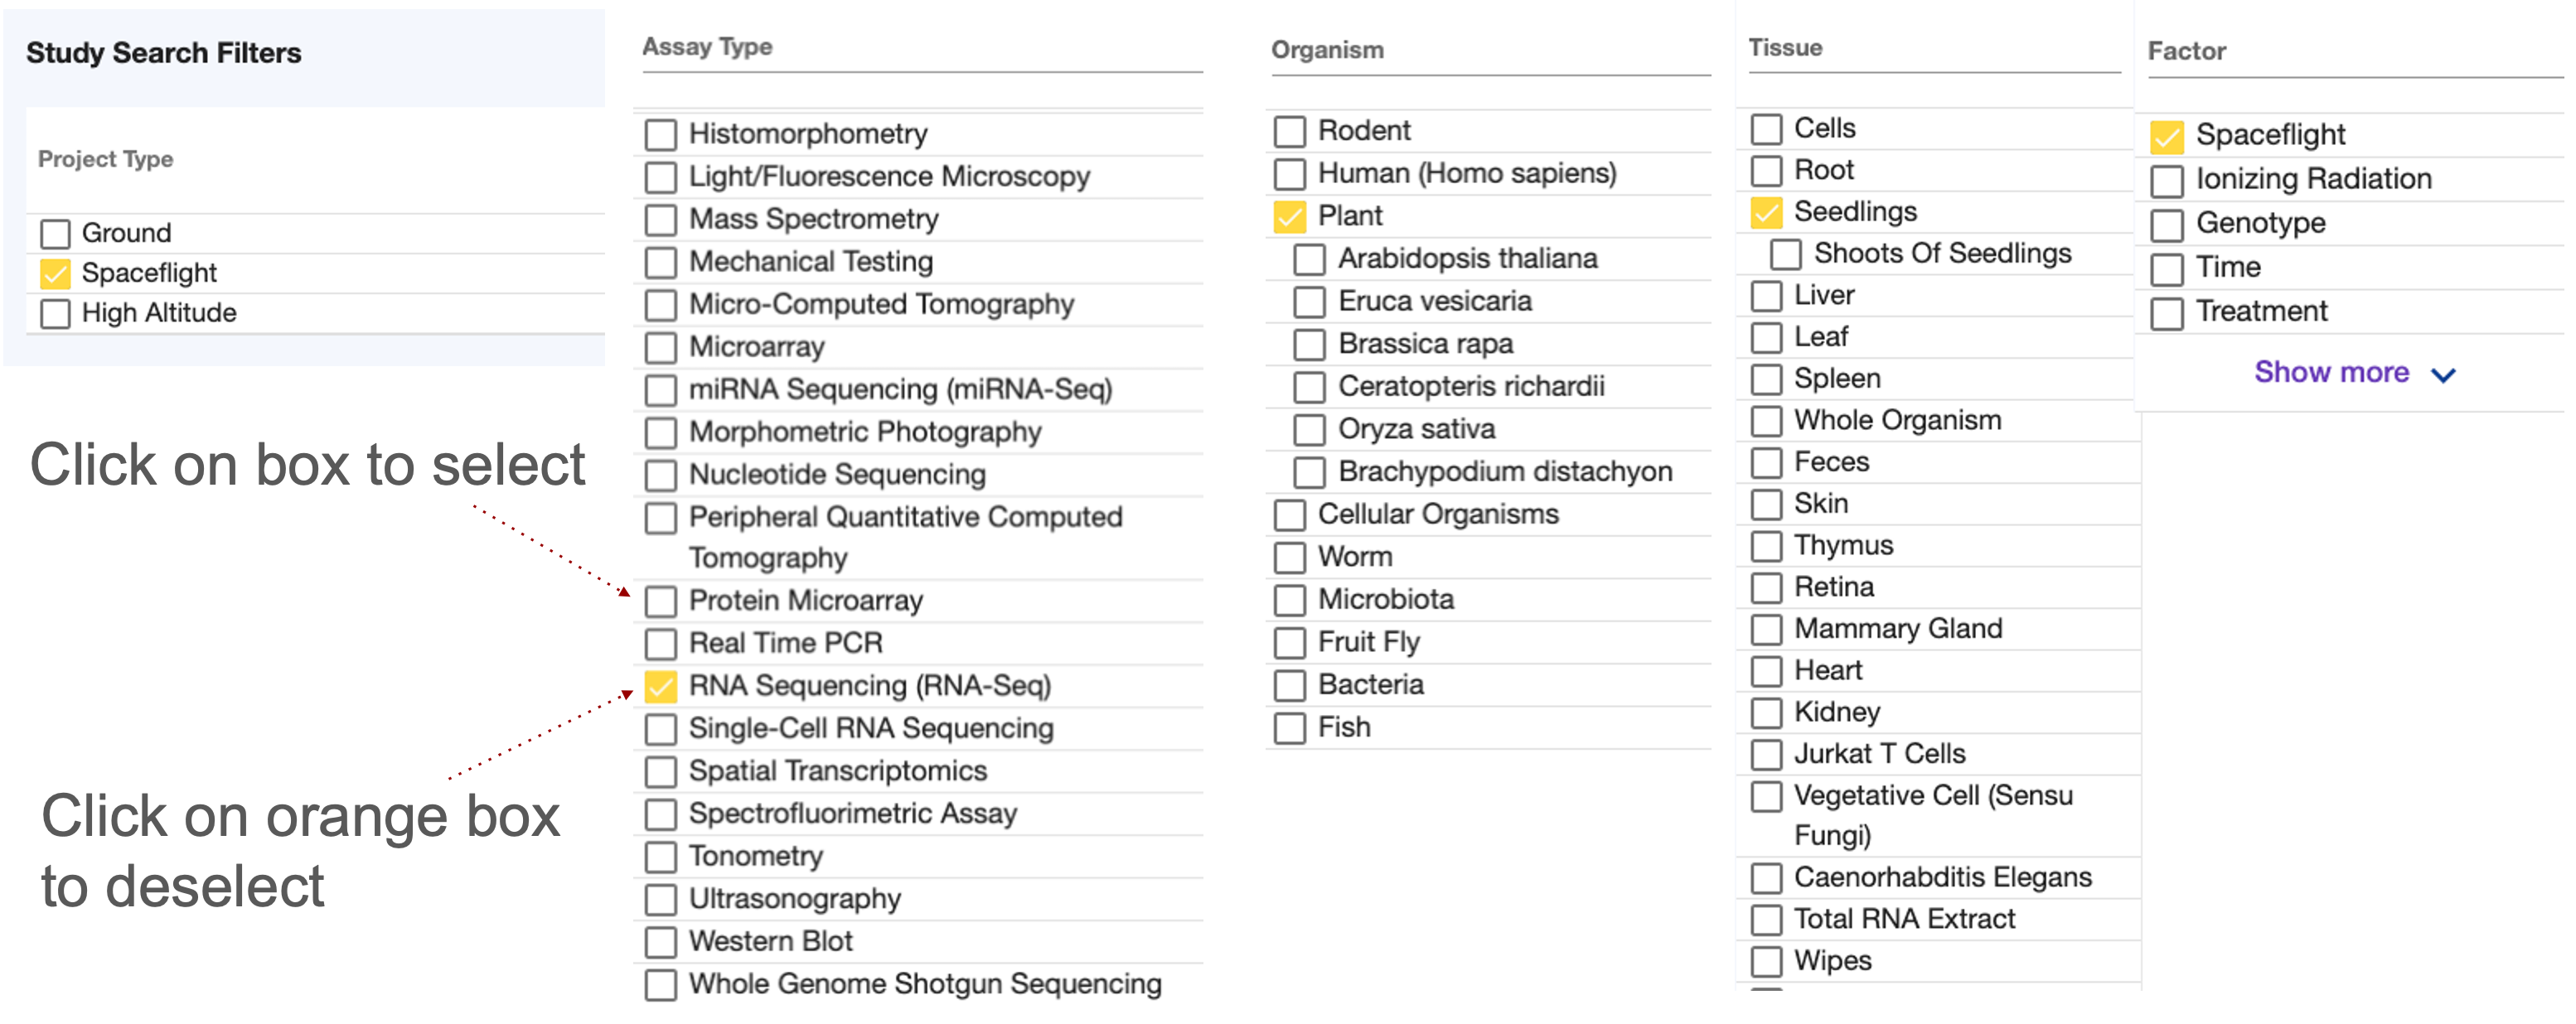
The Image shows a series of Filters grouped by Assay type, Organism, Tissue and Factor. Spaceflight, RNAseq, Plant and Seedling were selected.
Searching OSDR metadata
Note: When examining the Uniform Resource Locator (URL) in your web browser, users can swiftly navigate between various studies by simply modifying the numeric value after the web link. This capability enables the user to transition between distinct studies swiftly.
https://osdr.nasa.gov/bio/repo/data/studies/OSD-37
https://osdr.nasa.gov/bio/repo/data/studies/OSD-###
Single study: Navigate to a study of interest by searching through the study metadata you can launch the visualization menu using the tab on the left menu. Click on each tab to navigate through the different sections: Description, Protocols, Sample and Assay Tables, Publications, Study Files and for some processed studies transcriptional visualization. After assessing the title, study descriptions and any related research paper you can use the data visualization application to learn more about some of the quantitative patterns within the biological data. Study metadata are viewable through a tabbed user interface for each study.
.png)
Screenshot showing an example study from the OSDR.
Single study data metadata page
The “Description” tab provides an overview of the study including a text description, contact information, experimental factors, organism(s), type of assay(s), project or mission details, funding information and citation information.
Description example: The red box highlights the “Description tab” view that has selected an example dataset, OSD-37. Below is a series of buttons that allow the user to navigate through the data to find details of interest.
.png)
The left-hand side of the webpage contains shortcut buttons that take you to additional information, such as a brief description of the experiment, the submission date of the experiment, the size of the data, the GeneLab ID associated with the data, the Digital Object Identifier (DOI), information about the source of the samples, and the assays, publications, files, and version history. The description box has been highlighted with a red dashed line. All the options on the menu on the left have been highlighted with red letters (A-K).
At the top of the page, you should be able to see an icon picture summarizing the model organism next to the study title, ID number and data release version #. Scrolling down will allow you to a description of the study, the factor(s), organism(s), assay(s), and descriptions of the related project metadata. On the left of the screen, you’ll see a series of buttons that can quickly navigate you down to different sections.
(A). Description - An abstract summary of the experiment
(B). Experiment(s) - “No associated Experiments” is not uncommon
(C). Payload(s) - “No associated Payloads” is not uncommon
(D). Mission(s) - “No associated Mission” is not uncommon
(E). Protocol(s) - provides the names and detailed descriptions of the sample collection, library construction, assay, treatment and any other protocol(s).
(F). Samples - Table of metadata describing the sample’s names including quantitive and qualitative metadata values describing how they were treated. Users can select which fields they wish to export and export them as .csv files for use as factors in new subsequent models.
(G). Assay(s) - Table of metadata linking the samples to quantitive and qualitative metadata about how they were processed. Users can select which fields they wish to export as .csv files that can be used as factors in downstream statistical models.
(H). Publication(s) - Title, Authors, PubMedID, DOI## and web link to papers associated with this study. These provide a first-hand account of the study from the researchers who conducted the primary study.
(I). File(s) - A directory showing the OSD archive data folders that contain the study metadata, the raw or processed data provided by the research team and any extra processed data created by the GeneLab team.
(J). Version History - Date of the release of the current version and any associated files that were updated.
(K). Visualization - Launches into a new tab in the browser and provides insights into the GeneLab studies with processed data. “No processed data” is not uncommon.
Access the data and details about how the experiment
Navigation panel
To the left of the screen is the navigation panel, this allows users to assess all the different sections of the repository and then go directly to the information they are looking for.
.png)
The navigation panel on the left a;llows you to move to sections of interst.
Study Overview: Title, icon, GeneLab ID, ALDSA ID and DOI
The top of the page contains the title of the study, the unique GeneLab ID, and if applicable, an ALSDA ID for other non-omics data such as photography or microscopy. The DOI provides a unique identifier for the entire study.
.png)
Description: Factors, organism, assay(s), project and contact information.
This section provides a description of the experiment, a summary of the factors, organism used, assays performed and project information.
.png)
Screenshot showing the project description infcluding the factors, organism, assay(s), project and contact information.
Experiments
Some studies provide descriptions of experiments, while others use the primary publication for this purpose. The OSDR now encourages all users to add a description of their experiment in the “Experiments” field.
.png)
Payloads
Flight mission are sent to space flight environments as payloads on vehicles. These payloads are reif given operation identifiers to assist with flight operations.
In this example the payload identifier is CARA, this comes from its mission name “Characterizing Arabidopsis Root Attractions (CARA)”, along with a description of the experiment.
.png)
Missions
Experimental payloads are loaded in specific space flight “Missions”, these determine the launch vehicle, launch date and “end date”.
In this example, SpaceX-3 was the launch vehicle and the dragon then facilitated transit to the ISS and then back to Earth.
.png)
Protocols
The protocol section contains all the information related to how the samples were processed. This information variest depending on the study, but can include basic image acquisition protocols used by astronauts to more complex multi-stage sample processing and automated analysis that occurs with popular technology such as RNAseq.
.png)
Screenshot showing the protocol section, this study contains example photography acquisition and analysis descriptions.
.png)
Screenshot showing the protocol section, this study contains examples of nucleic acid extraction and library construction for RNAseq analysis.
Samples
Selecting sample(s) data for export
The samples tab contains data that can be downloaded for new statistical analysis.
The “Samples” and “Assays” tabs provide sample and assay level details formatted in a navigatable table. These tabs include specific organism characteristics, study factors and treatments, sample and sample processing metadata, assay execution parameters, and data processing metadata. Use the bottom navigation bar to scroll through all the columns, and the right margin scroll bar to navigate the rows.
Sample example: A OSD dataset, OSD-37, sample name tab and sort/filter functions. The select export column button in the top left corner allows the selection and download of the most important sample factors. Entries in the table with Blue text provide links to ontology databases to help define their meaning. In the bottom right corner the number of entries on the page is set to 25 as default, many studies have more samples, so you can either navigate through the samples with the arrow button(s) or increase the number of entries per page to 50 or >~100.
.png)
The image shows the “Samples” tab selection which includes the name of the samples. The table contains data describing the characteristics of the samples and providing links to some ontology terms that can be used to define experimental factors. The Select Export Columns button has been highlighted with a red box and a red dotted arrow.
Selecting assay data for export
The Assay(s) tab contains data that can be saved or used to develop new statistical tests.
There are many fields of data, users can scroll left and right using the slider bar at the bottom of the table or by “holding shift” while scrolling with a “mouse wheel”.
Assays example: A GeneLab dataset, OSD-37, assay name tab and sort/filter functions. Some studies have more than one assay type which can be accessed using the drop-down menu in the top right-hand corner. These columns can be selected for download using the export column button. Some fields are links to data files that can be downed directly from the webpage, “right-click” on the entries with blue text and select “download” from the options.
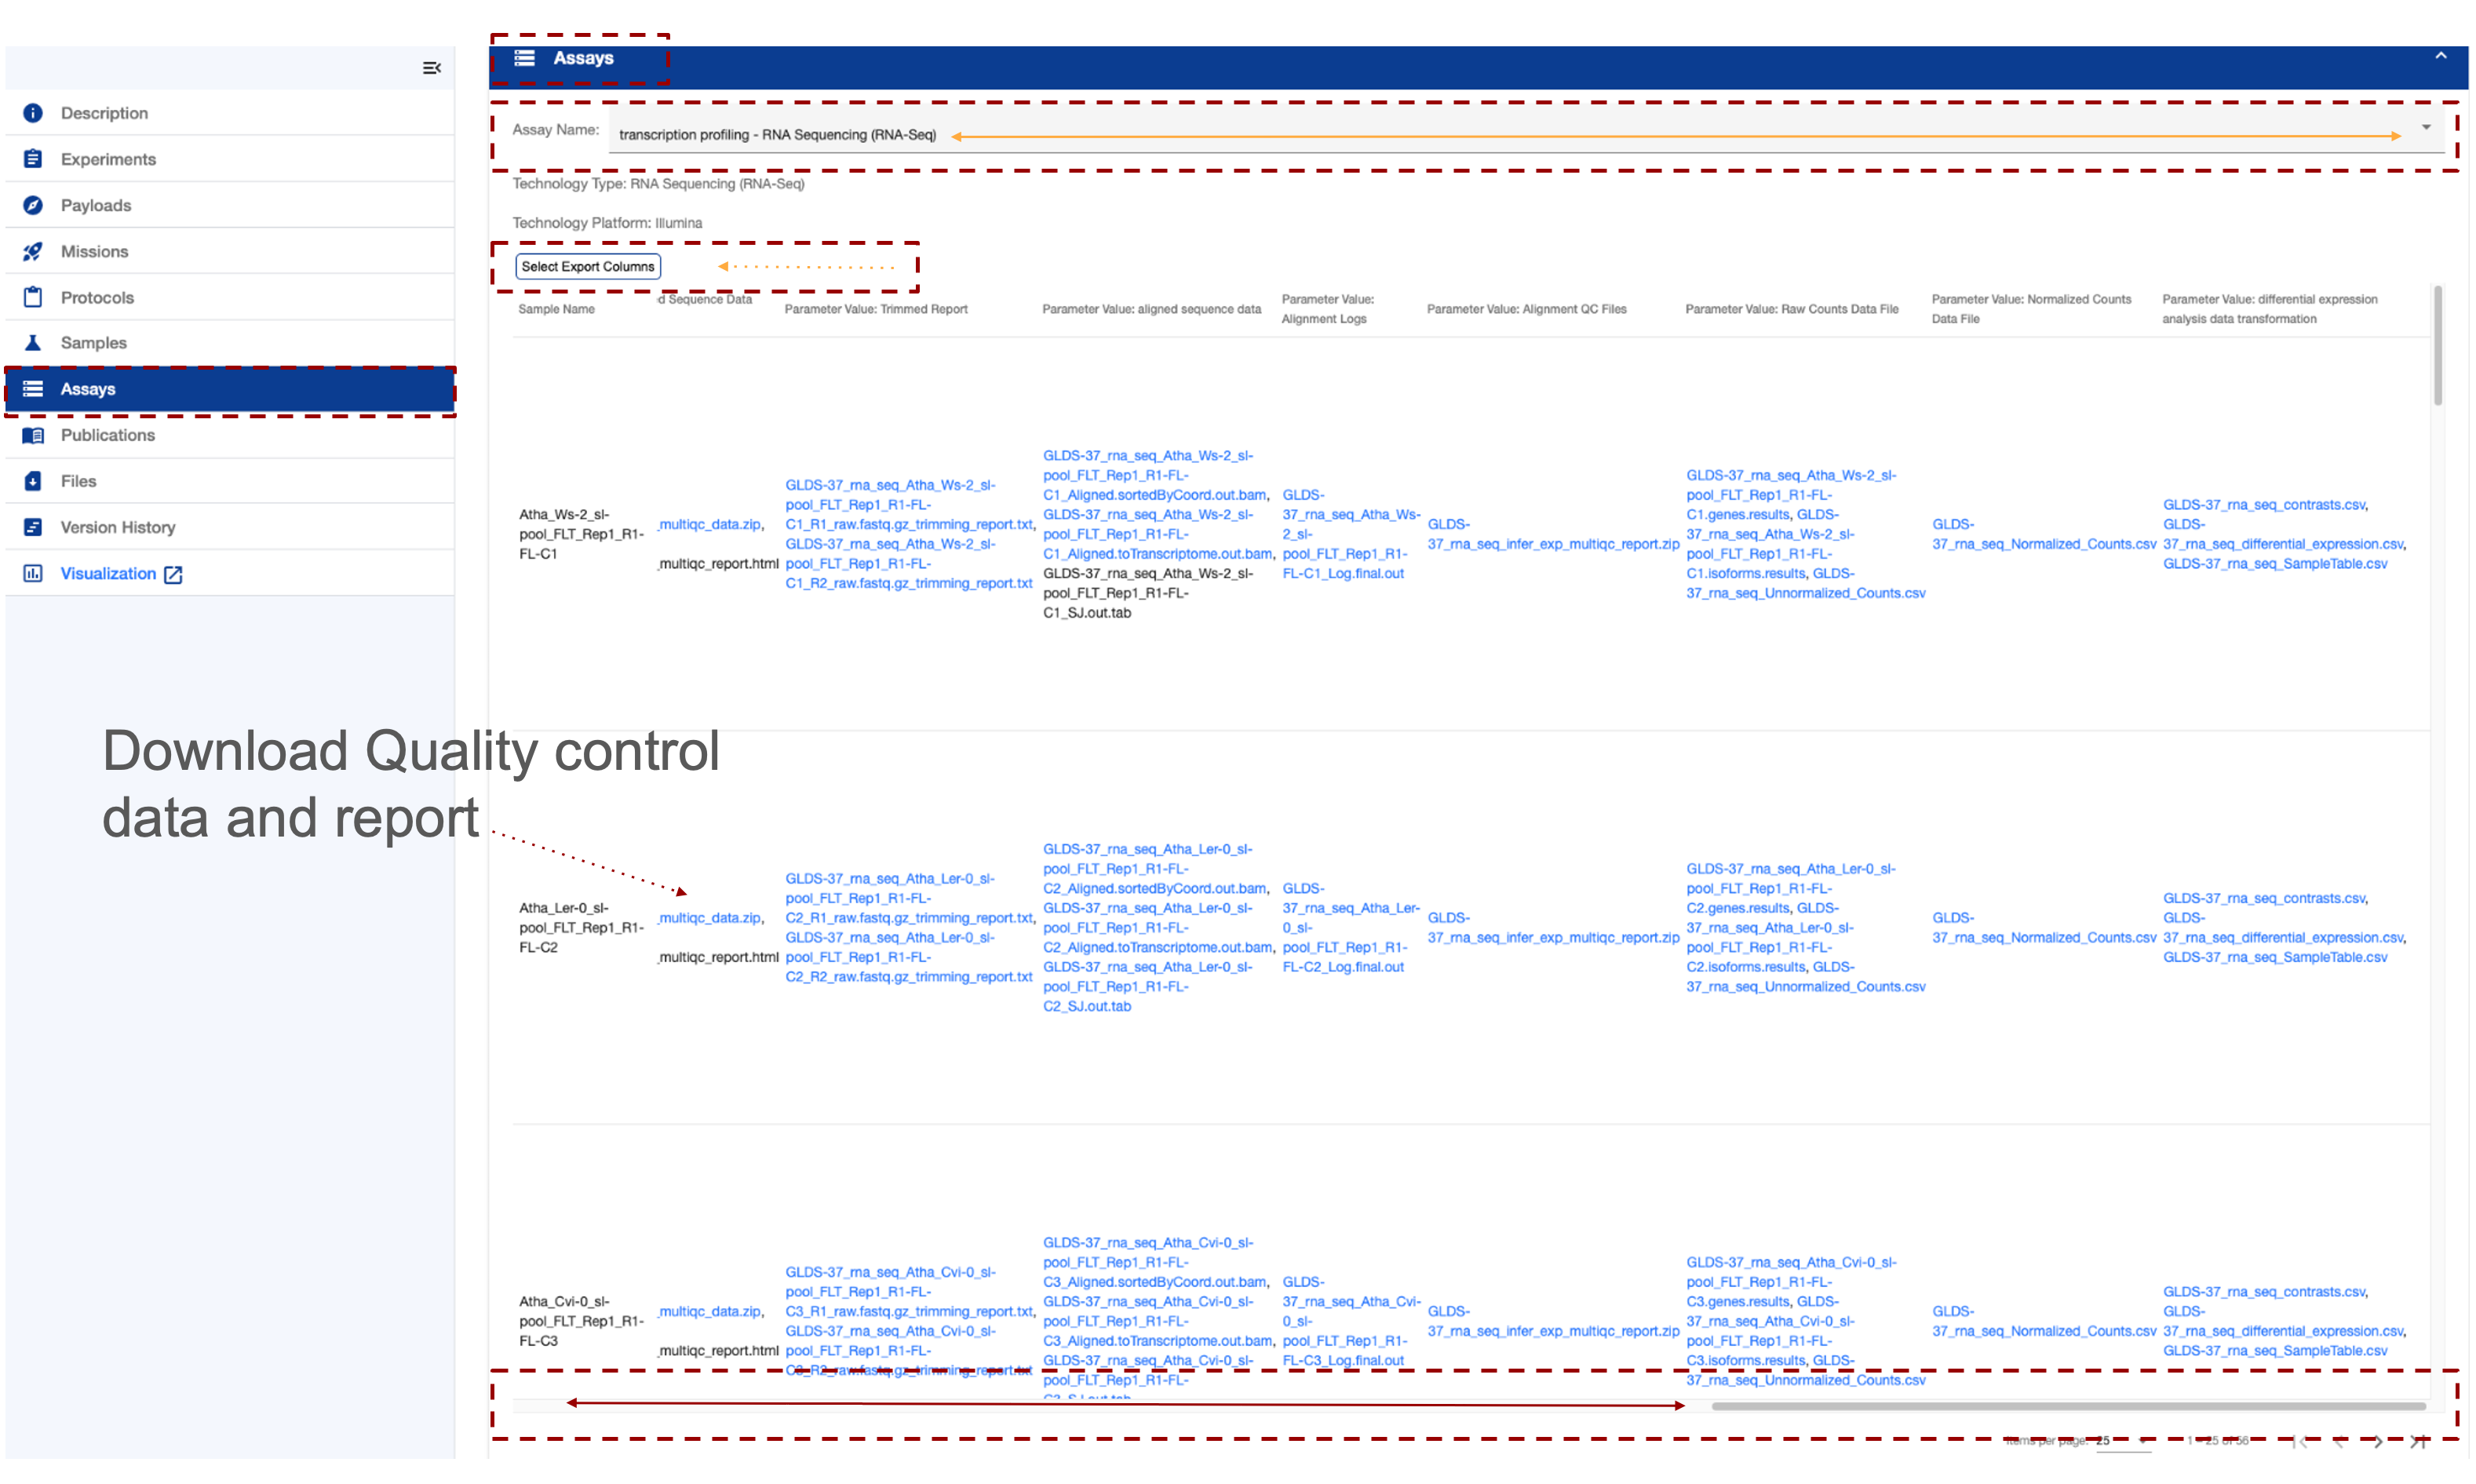
Please remember that you change between different types of assay and can scroll lef and right to observe more metadata information.
Exporting tables to csv, txt, or .xls
Assay data tables can be exported from OSDR and saved or used on local or cloud-based computers.
Users can download selected columns from the Samples and/or Assays table. Click on the Select Export Columns button. Select the desired columns and click Export CSV or desired format.
Assay example: The OSDR dataset, OSD-37, the “select export columns” has been selected. The Export CSV can be seen at the center top of the table. The user can select which columns or “Fields” they’d like to download by selecting boxes next to the options. The button left corner has “select all”, “unselect all” and close buttons.
The File(s) tab provides raw and processed data
This resource allows you to access and download the raw and processed data.
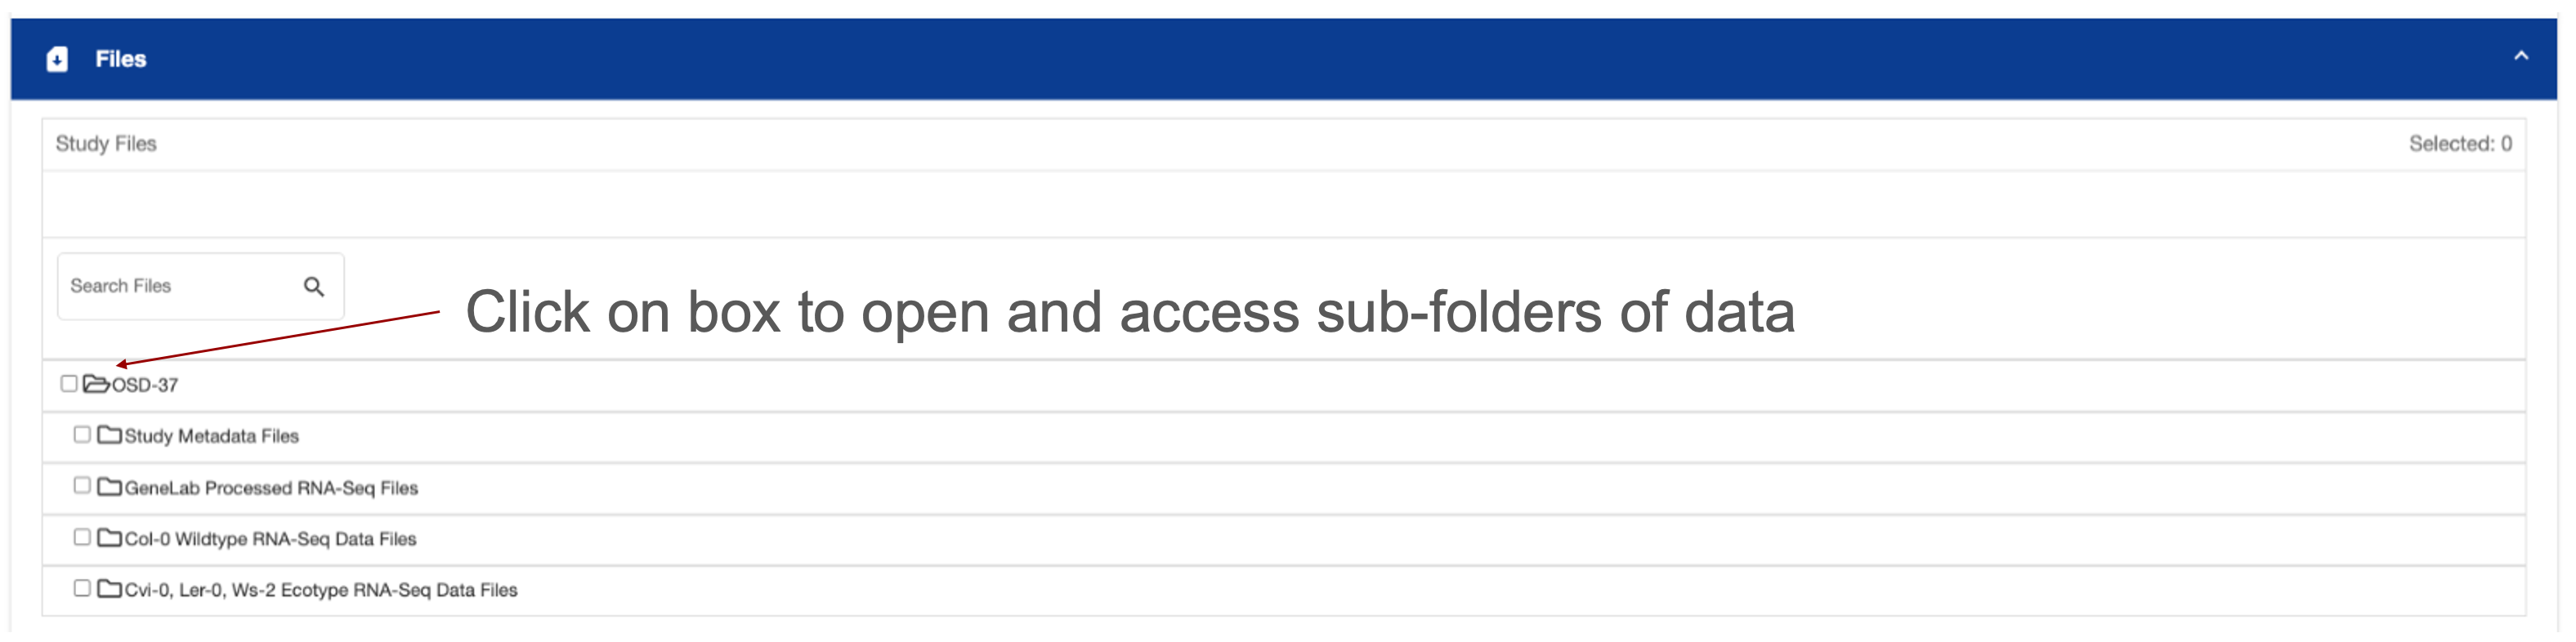
The Study Files tab provides metadata and raw or processed study data files. Each row includes information about the size, type, and description. Click on the file name to download. You can download multiple files by clicking the checkbox at the left of the file name to select and then clicking the “Download Selected Files” button. To select all files in a resource category, navigate to the desired folder by selecting the folder name and then click on the checkbox at the top of the table, next to the Files column name.
File example: Study files view and sort/filter functions for OSDR dataset, OSD-37.