smallRNAseq-DREAM
A cross-species small RNA-seq (miRNA) analysis framework, with an inventory of NASA Open Science Data Repository (OSDR) plant RNA-seq studies.
01Status of the Plant miRNA Scan
The plant miRNA outputs in this repository are not interpretable yet. An evidence check on 2026-10-28 found three problems:
- OSD-437 is standard poly(A) RNA-seq, not small RNA-seq. Its OSDR record lists one RNA-Seq assay (19 samples, library selection "polyA enrichment", NEB Next Ultra II RNA Library Prep Kit). OSDR holds no plant small RNA-seq.
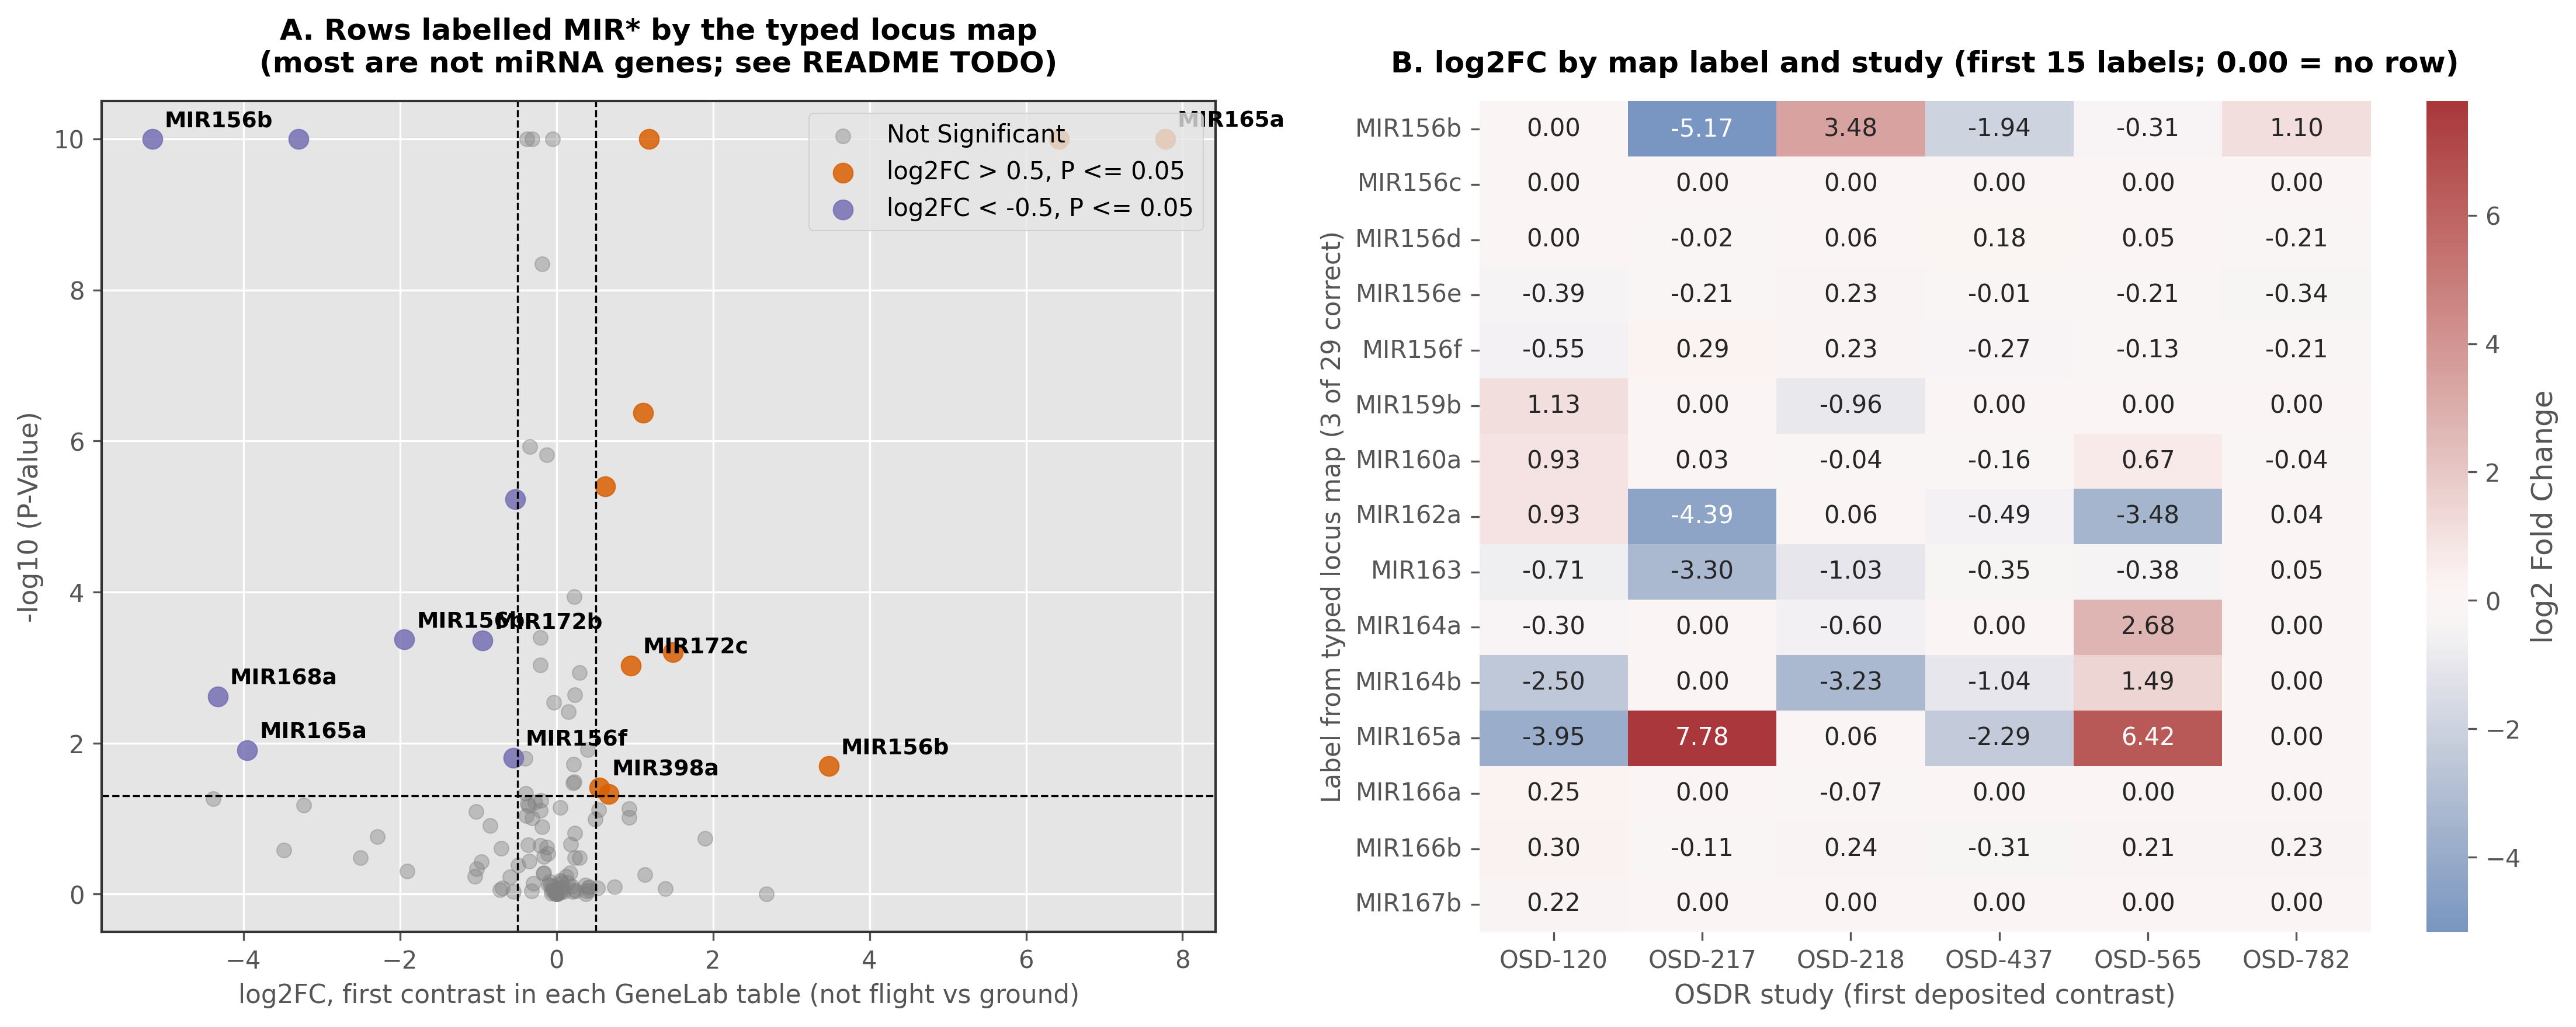
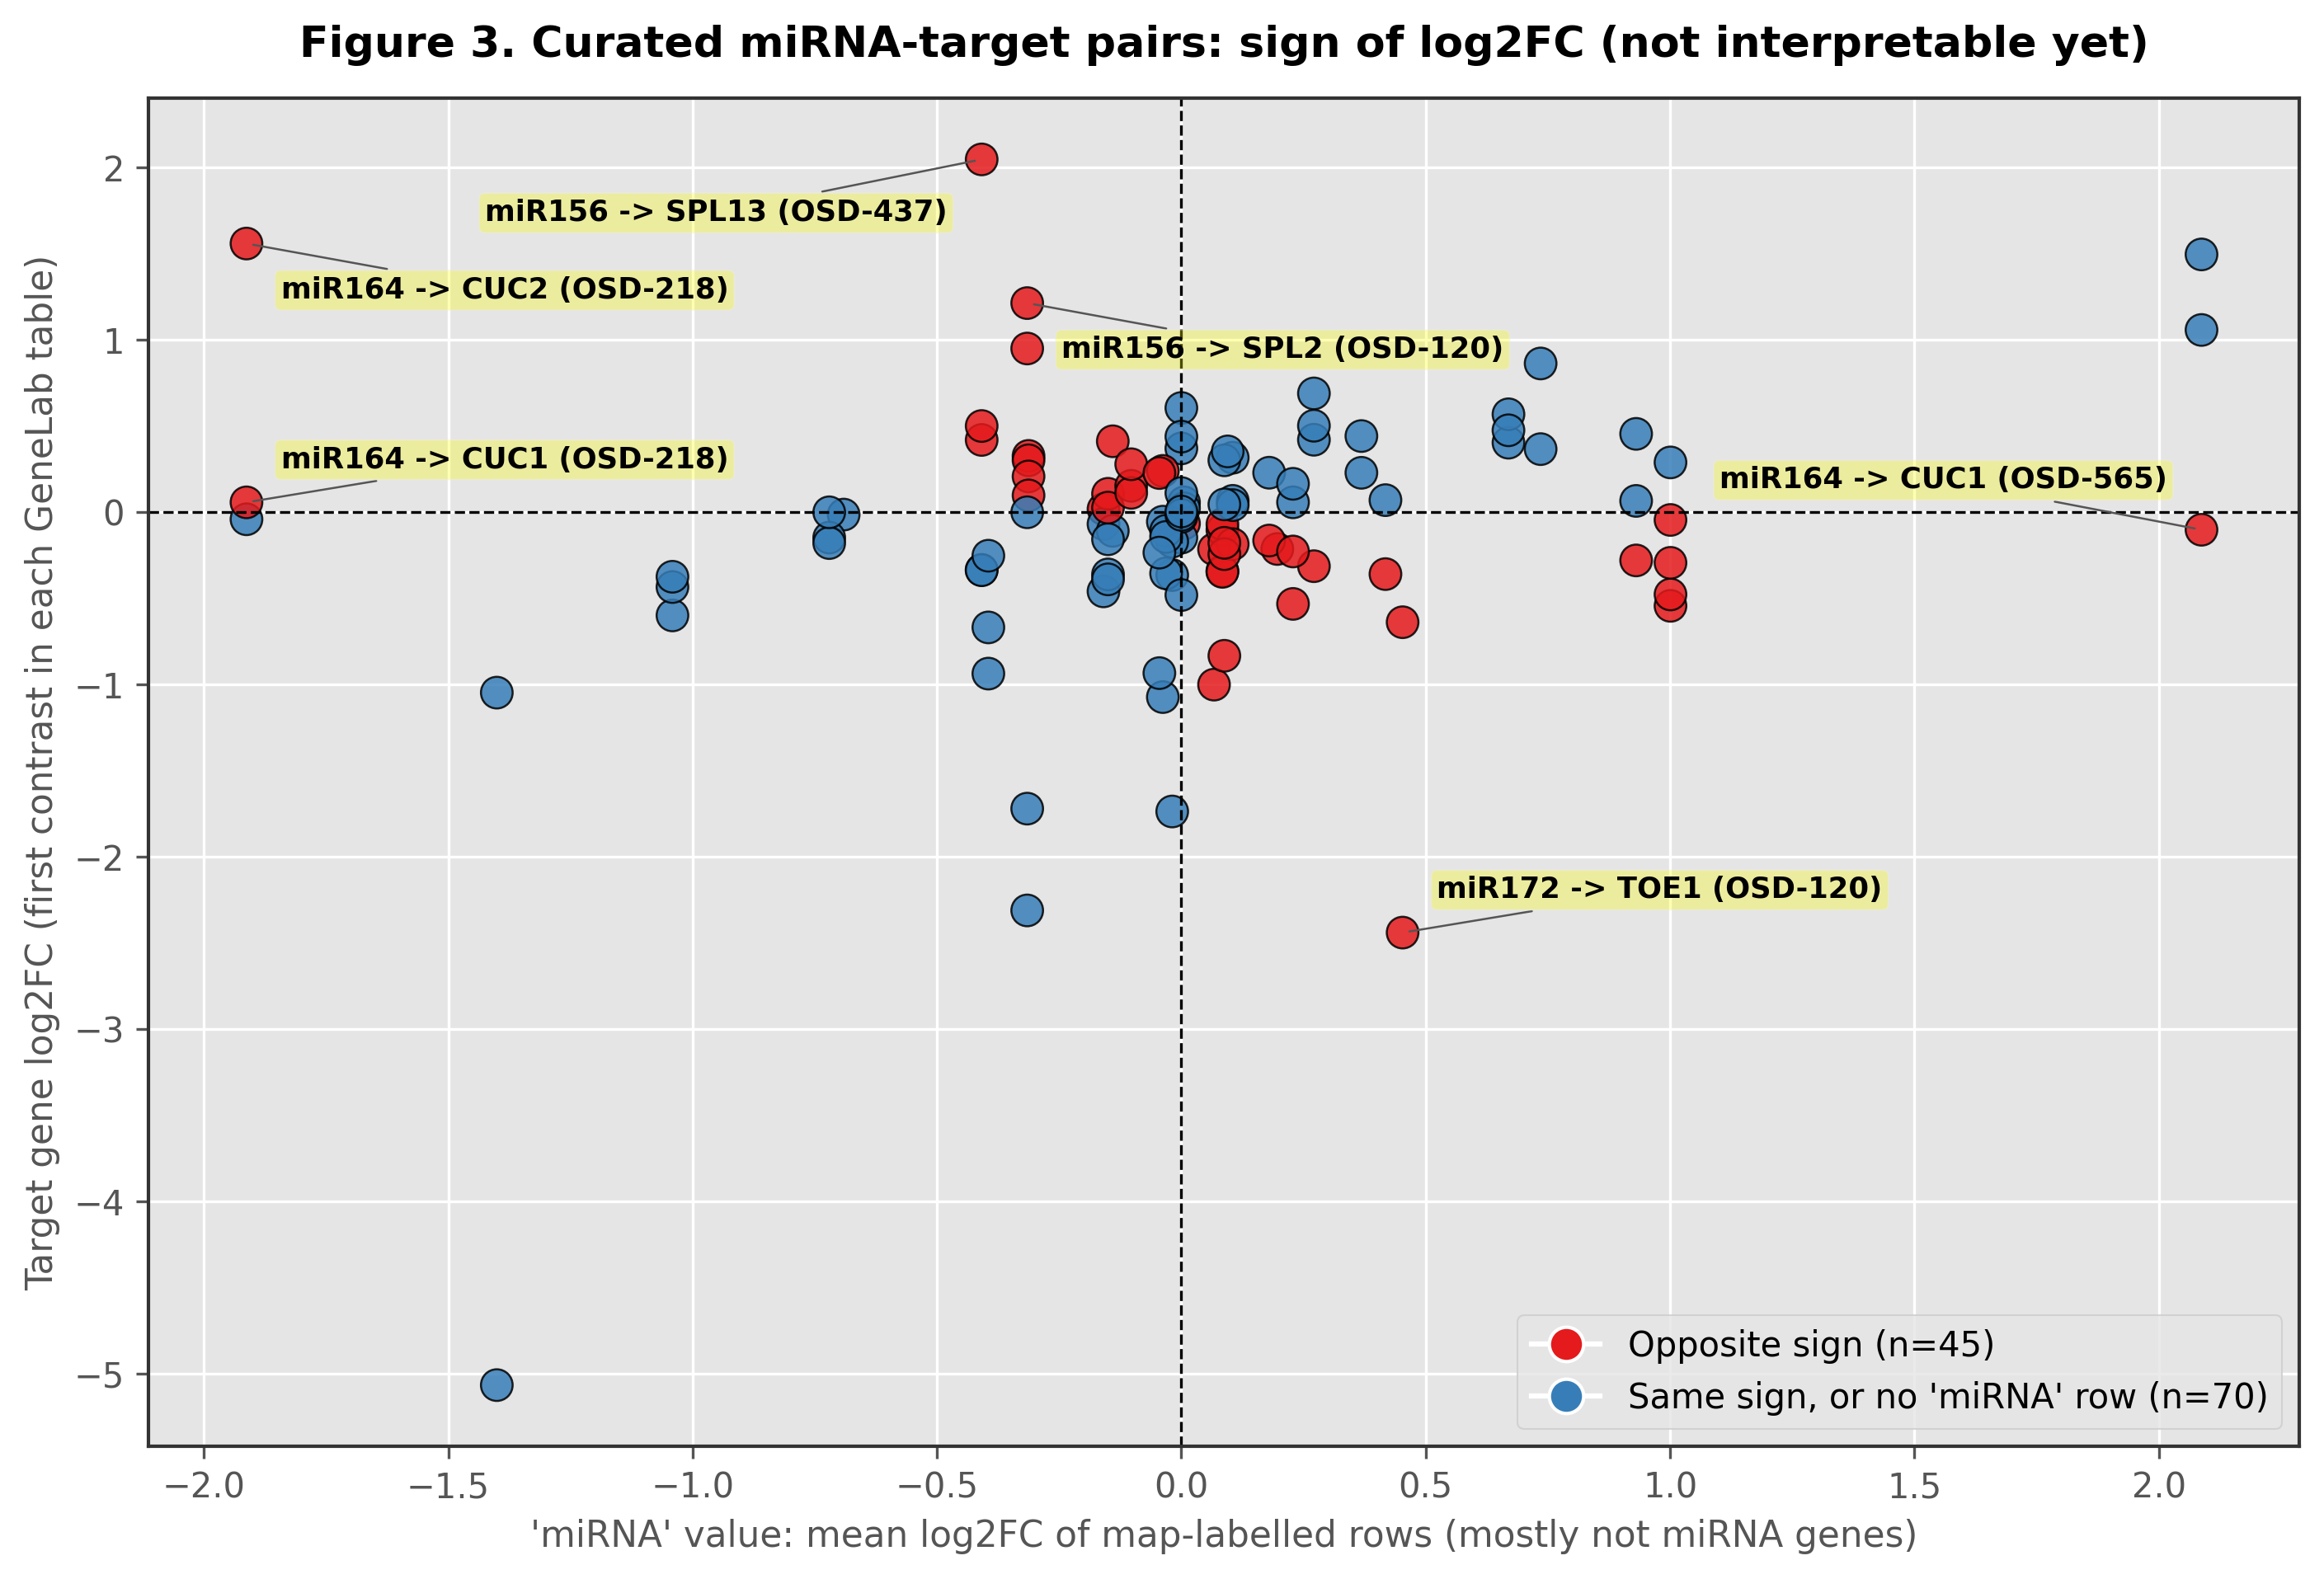
- The locus map mislabels most IDs. Of the 29 IDs the hand-typed map labels as MIR genes, 3 are the named MIR gene. 16 are protein-coding (for example AT1G53160 is SPL4, labelled "MIR156b"), 2 are lncRNA, 1 is snoRNA and 7 are a different MIR gene (Ensembl Plants lookup).
- The fold changes are not flight vs ground. The scan uses the first contrast in each GeneLab table. For OSD-437 that is 1g centrifuge vs microgravity, both in flight. For OSD-120, OSD-218, OSD-565 and OSD-782 it compares ground or treatment groups. For OSD-217 it is ground vs flight, the reverse orientation.
TODO: rebuild the locus map from Ensembl Plants miRNA genes, select each study's flight-vs-ground contrast by name, then regenerate the tables and figures. Until then, no miRNA result from this scan should be cited.
02The Recommended Pipeline Route
From hands-on testing of four small RNA-seq analysis engines (nf-core/smrnaseq, sRNAtoolbox, miRDeep2, miRDeep-P2), the author recommends this route for cross-species analysis. The quantitative four-engine benchmark has not been run yet.
SRA → mirnaQC → sRNAbench → sRNAde → mirNOVO
nf-core/smrnaseq runs under Nextflow's container profiles. The original SLURM/OSDR cluster script was lost before consolidation, and the sRNAtoolbox Singularity definition is still to be added.
03NASA OSDR Plant Dataset Inventory
Twelve plant RNA-seq studies in NASA OSDR: 9 spaceflight, 1 suborbital (high-altitude) and 2 ground studies, across Arabidopsis thaliana, Brachypodium distachyon, Solanum lycopersicum and Brassica rapa. Values are read from each study's OSDR record (2026-10-28). "Samples" counts the samples in the study's RNA-Seq assay; a blank cell means the record has no value.
| Study | Species | OSDR project type | Mission | Platform | Samples | Library selection |
|---|---|---|---|---|---|---|
| OSD-437 | Arabidopsis thaliana | Spaceflight Study | SpaceX-9 | European Modular Cultivation System (EMCS), Experimental Reference Module (ERM2) | 19 | polyA enrichment |
| OSD-120 | Arabidopsis thaliana | Spaceflight Study | SpaceX-3 | 36 | ribo-depletion | |
| OSD-218 | Arabidopsis thaliana | Spaceflight Study | SpaceX-5 | Vegetable Production System (VPS/Veggie) | 32 | polyA enrichment |
| OSD-217 | Arabidopsis thaliana | Spaceflight Study | SpaceX-5 | Vegetable Production System (VPS/Veggie) | 12 | cDNA |
| OSD-375 | Brachypodium distachyon | Spaceflight Study | SpaceX-14 | Vegetable Production System (VEGGIE), APEX Growth Unit | 48 | Ribo-depletion (32), cDNA (16) |
| OSD-480 | Arabidopsis thaliana | Spaceflight Study | SpaceX-13 | European Modular Cultivation System (EMCS) | 400 | |
| OSD-522 | Arabidopsis thaliana | Spaceflight Study | SpaceX-13, SpaceX-14 | BRIC-LED | 12 | polyA enrichment |
| OSD-565 | Arabidopsis thaliana | Ground Study | KSC Fixation Tubes (KFTs) | 45 | cDNA | |
| OSD-624 | Arabidopsis thaliana | High Altitude Study | Unity 22 | Kennedy Space Center Fixation Tubes (KFTs) | 36 | polyA enrichment |
| OSD-767 | Solanum lycopersicum | Spaceflight Study | SpaceX-26 | Vegetable Production System (Veggie) | 36 | polyA enrichment |
| OSD-782 | Arabidopsis thaliana | Ground Study | 36 | polyA enrichment | ||
| OSD-59 | Brassica rapa | Spaceflight Study | Expedition 22 | Lada | 2 | mRNA enrichment |
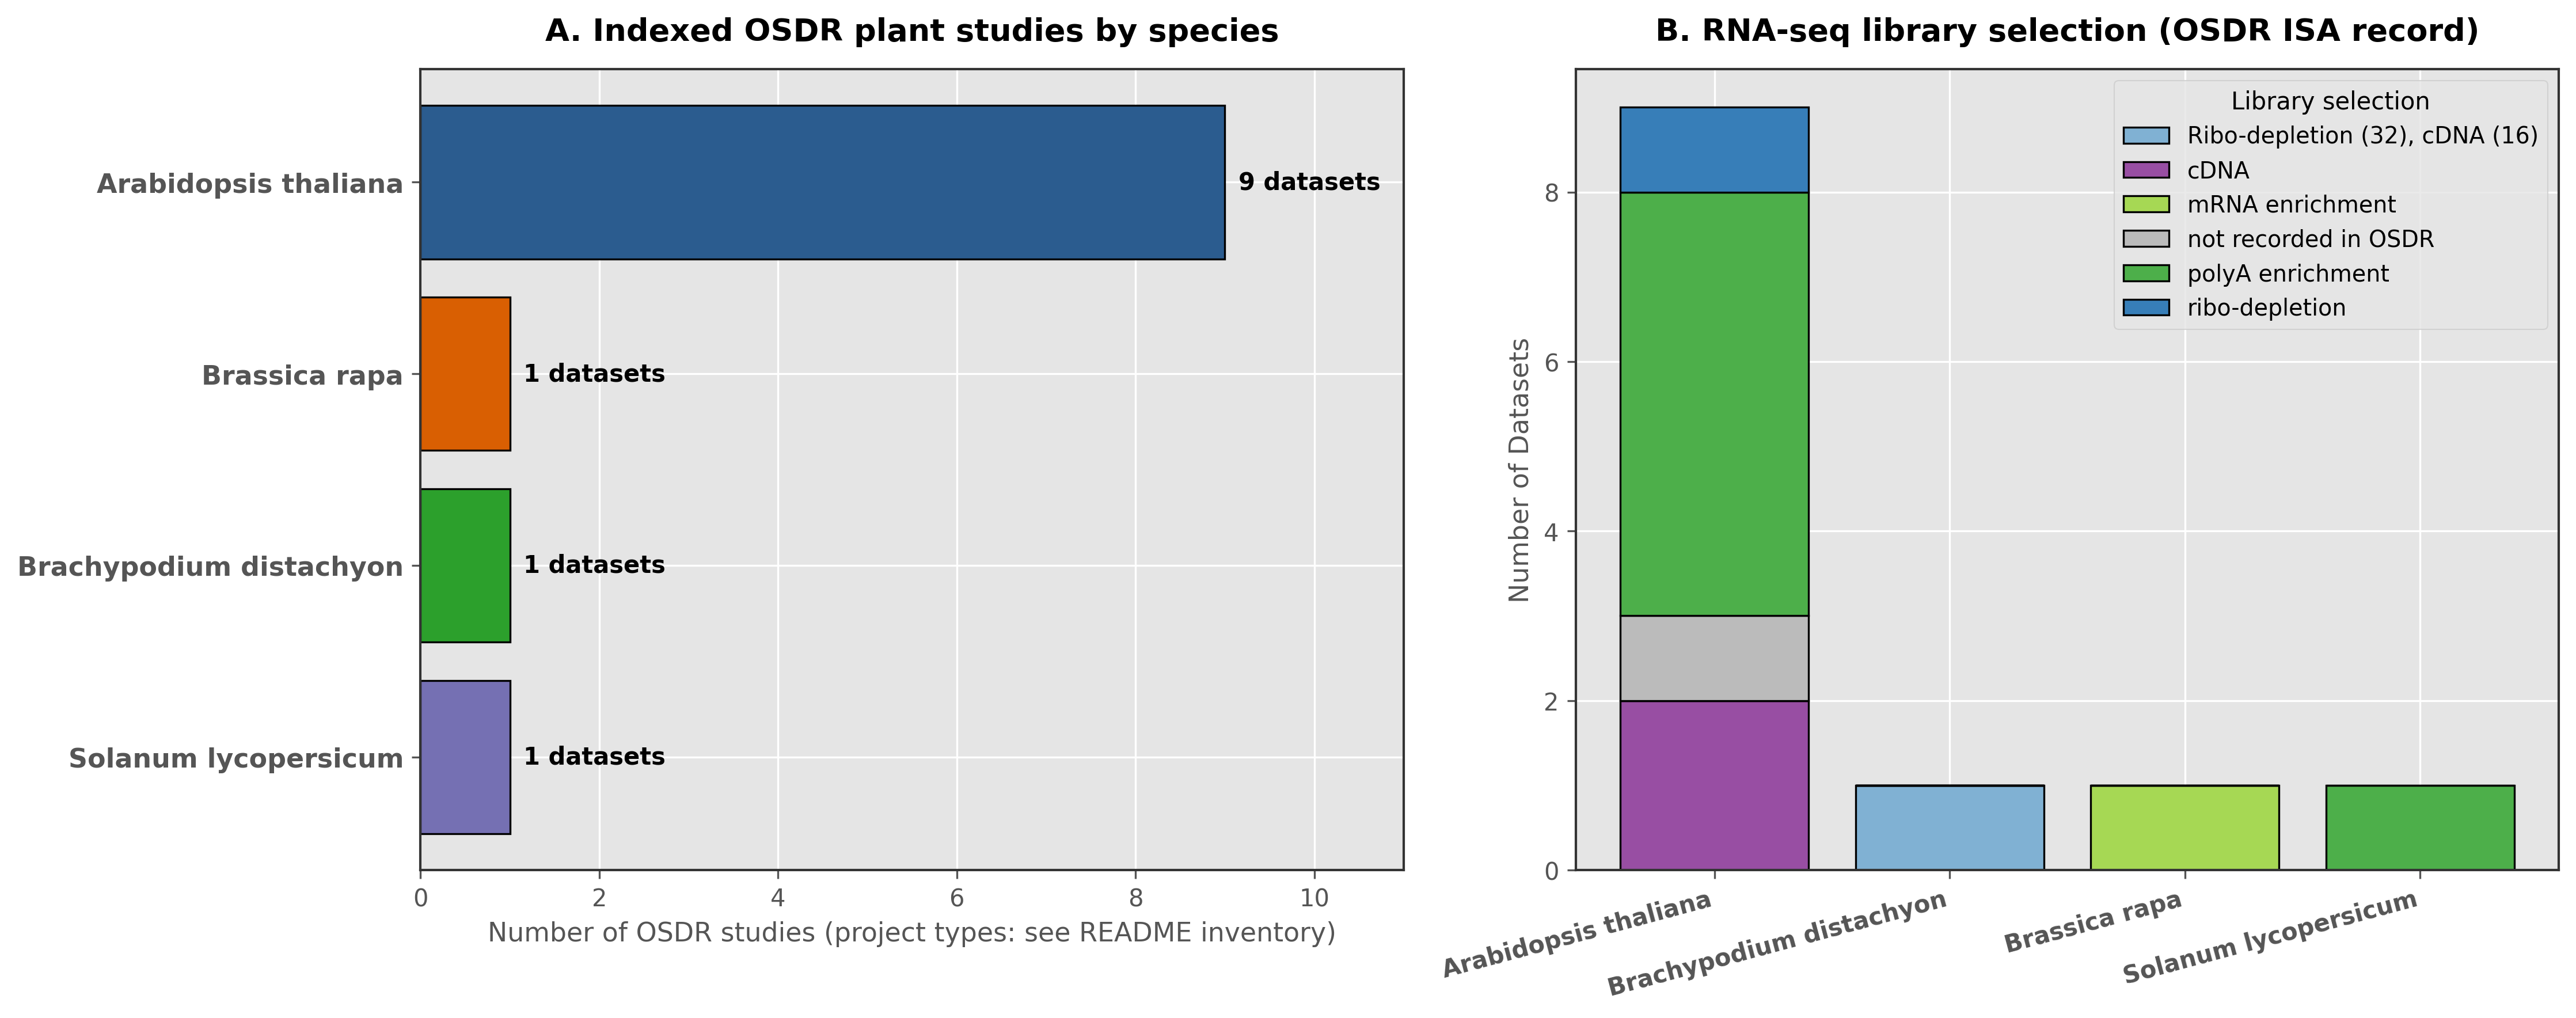
04Exploratory miRNA Scan (Not Interpretable Yet)
These figures plot the scan's current tables. They are kept so the TODO above can be checked against them, not as results.
05Illustrative Fisher Test
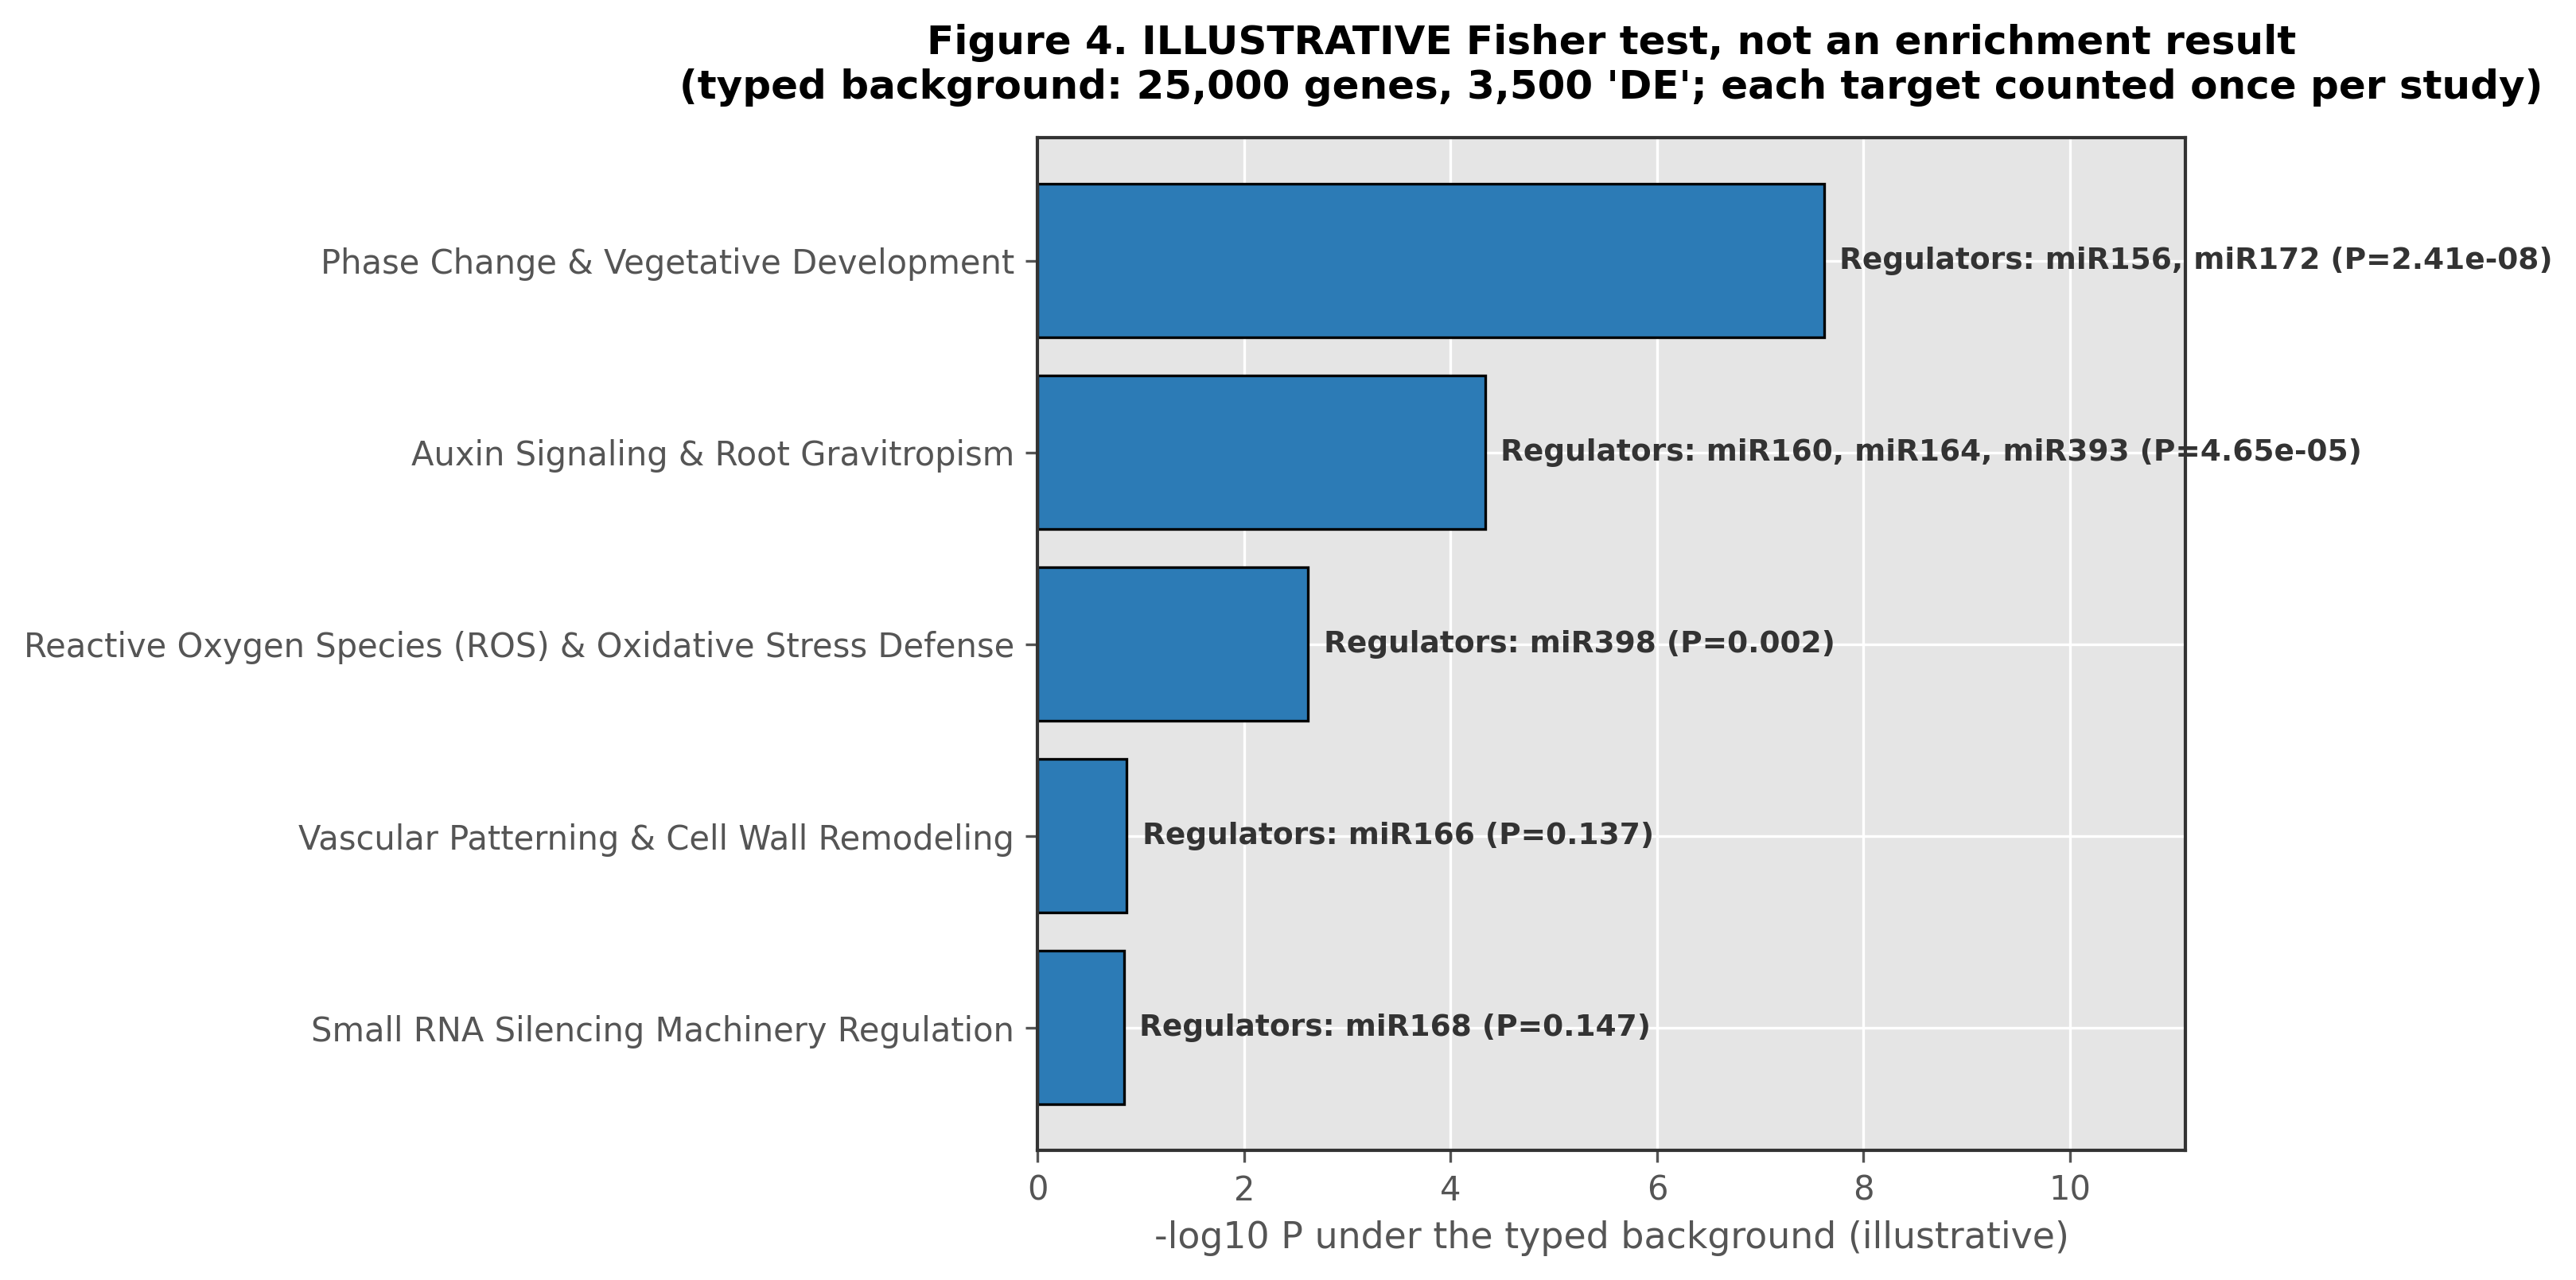
For each pathway, a Fisher exact test compares the pairs whose target has P ≤ 0.05 against a typed background of 25,000 genes and 3,500 "DE" genes, assumed rather than measured, and each target is counted once per study. The p-values are therefore illustrative, not an enrichment result. TODO: use each study's measured gene universe and DE set.
06Schematics and Network View
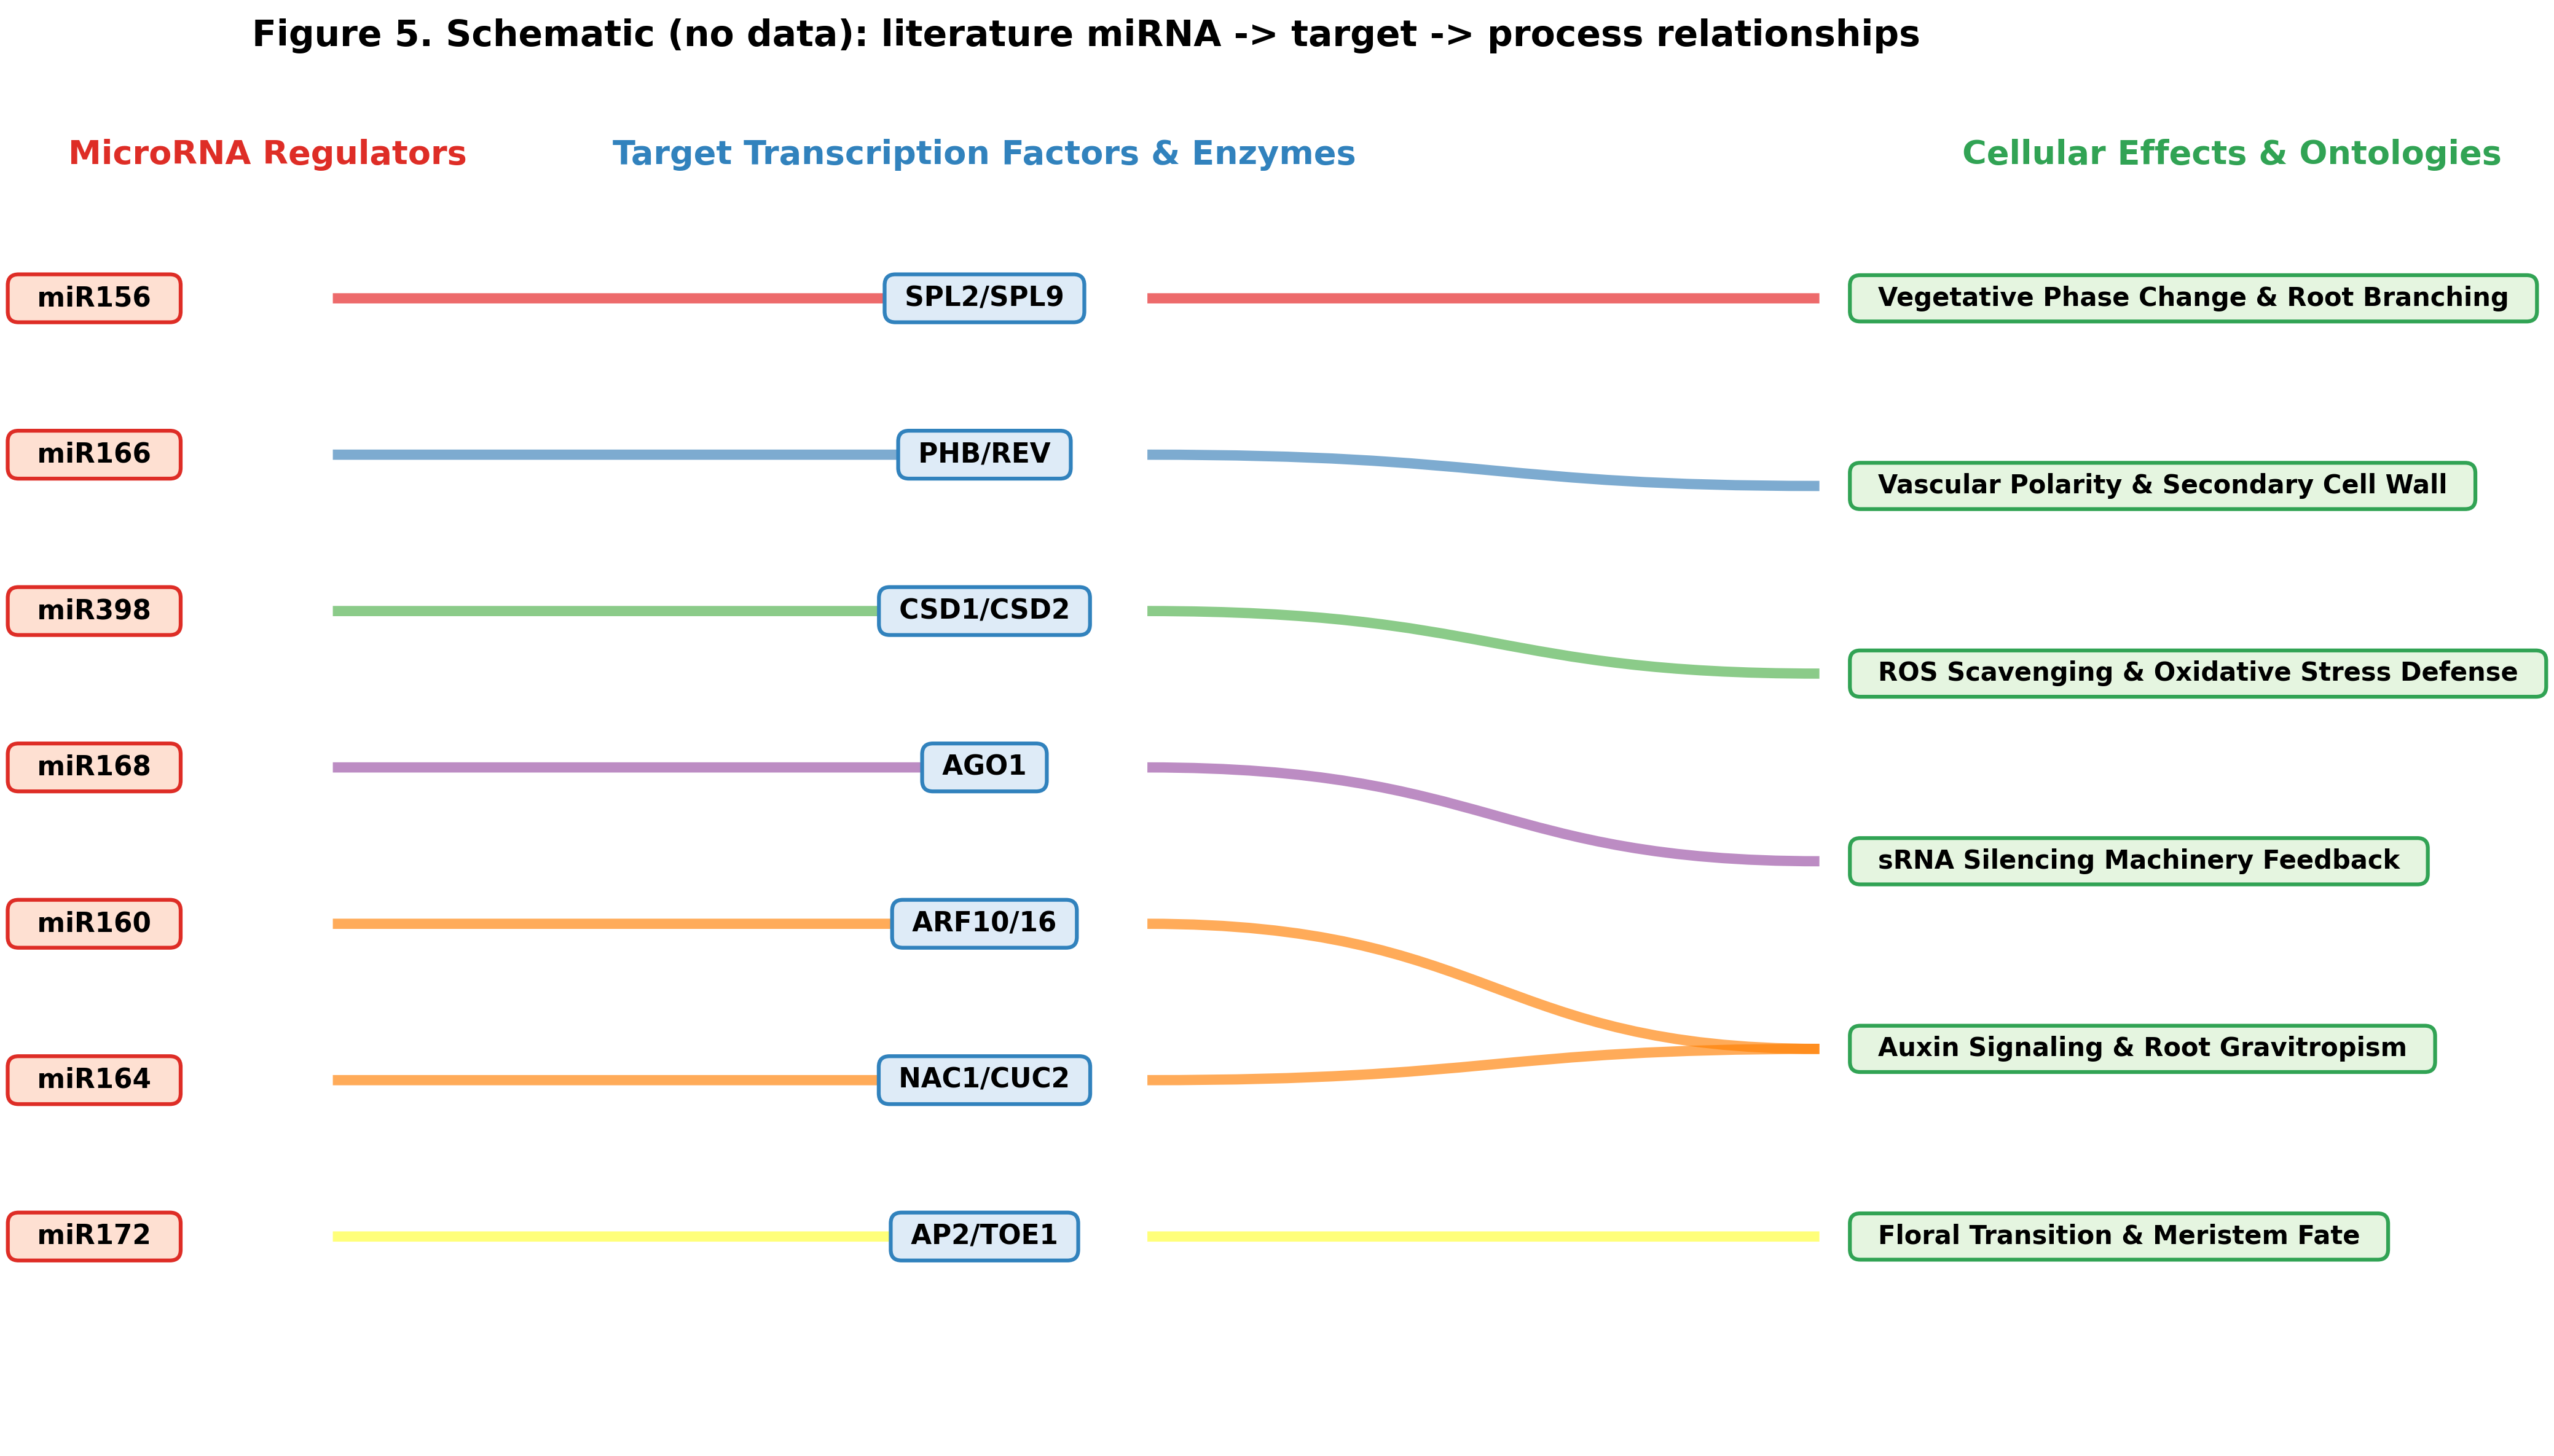
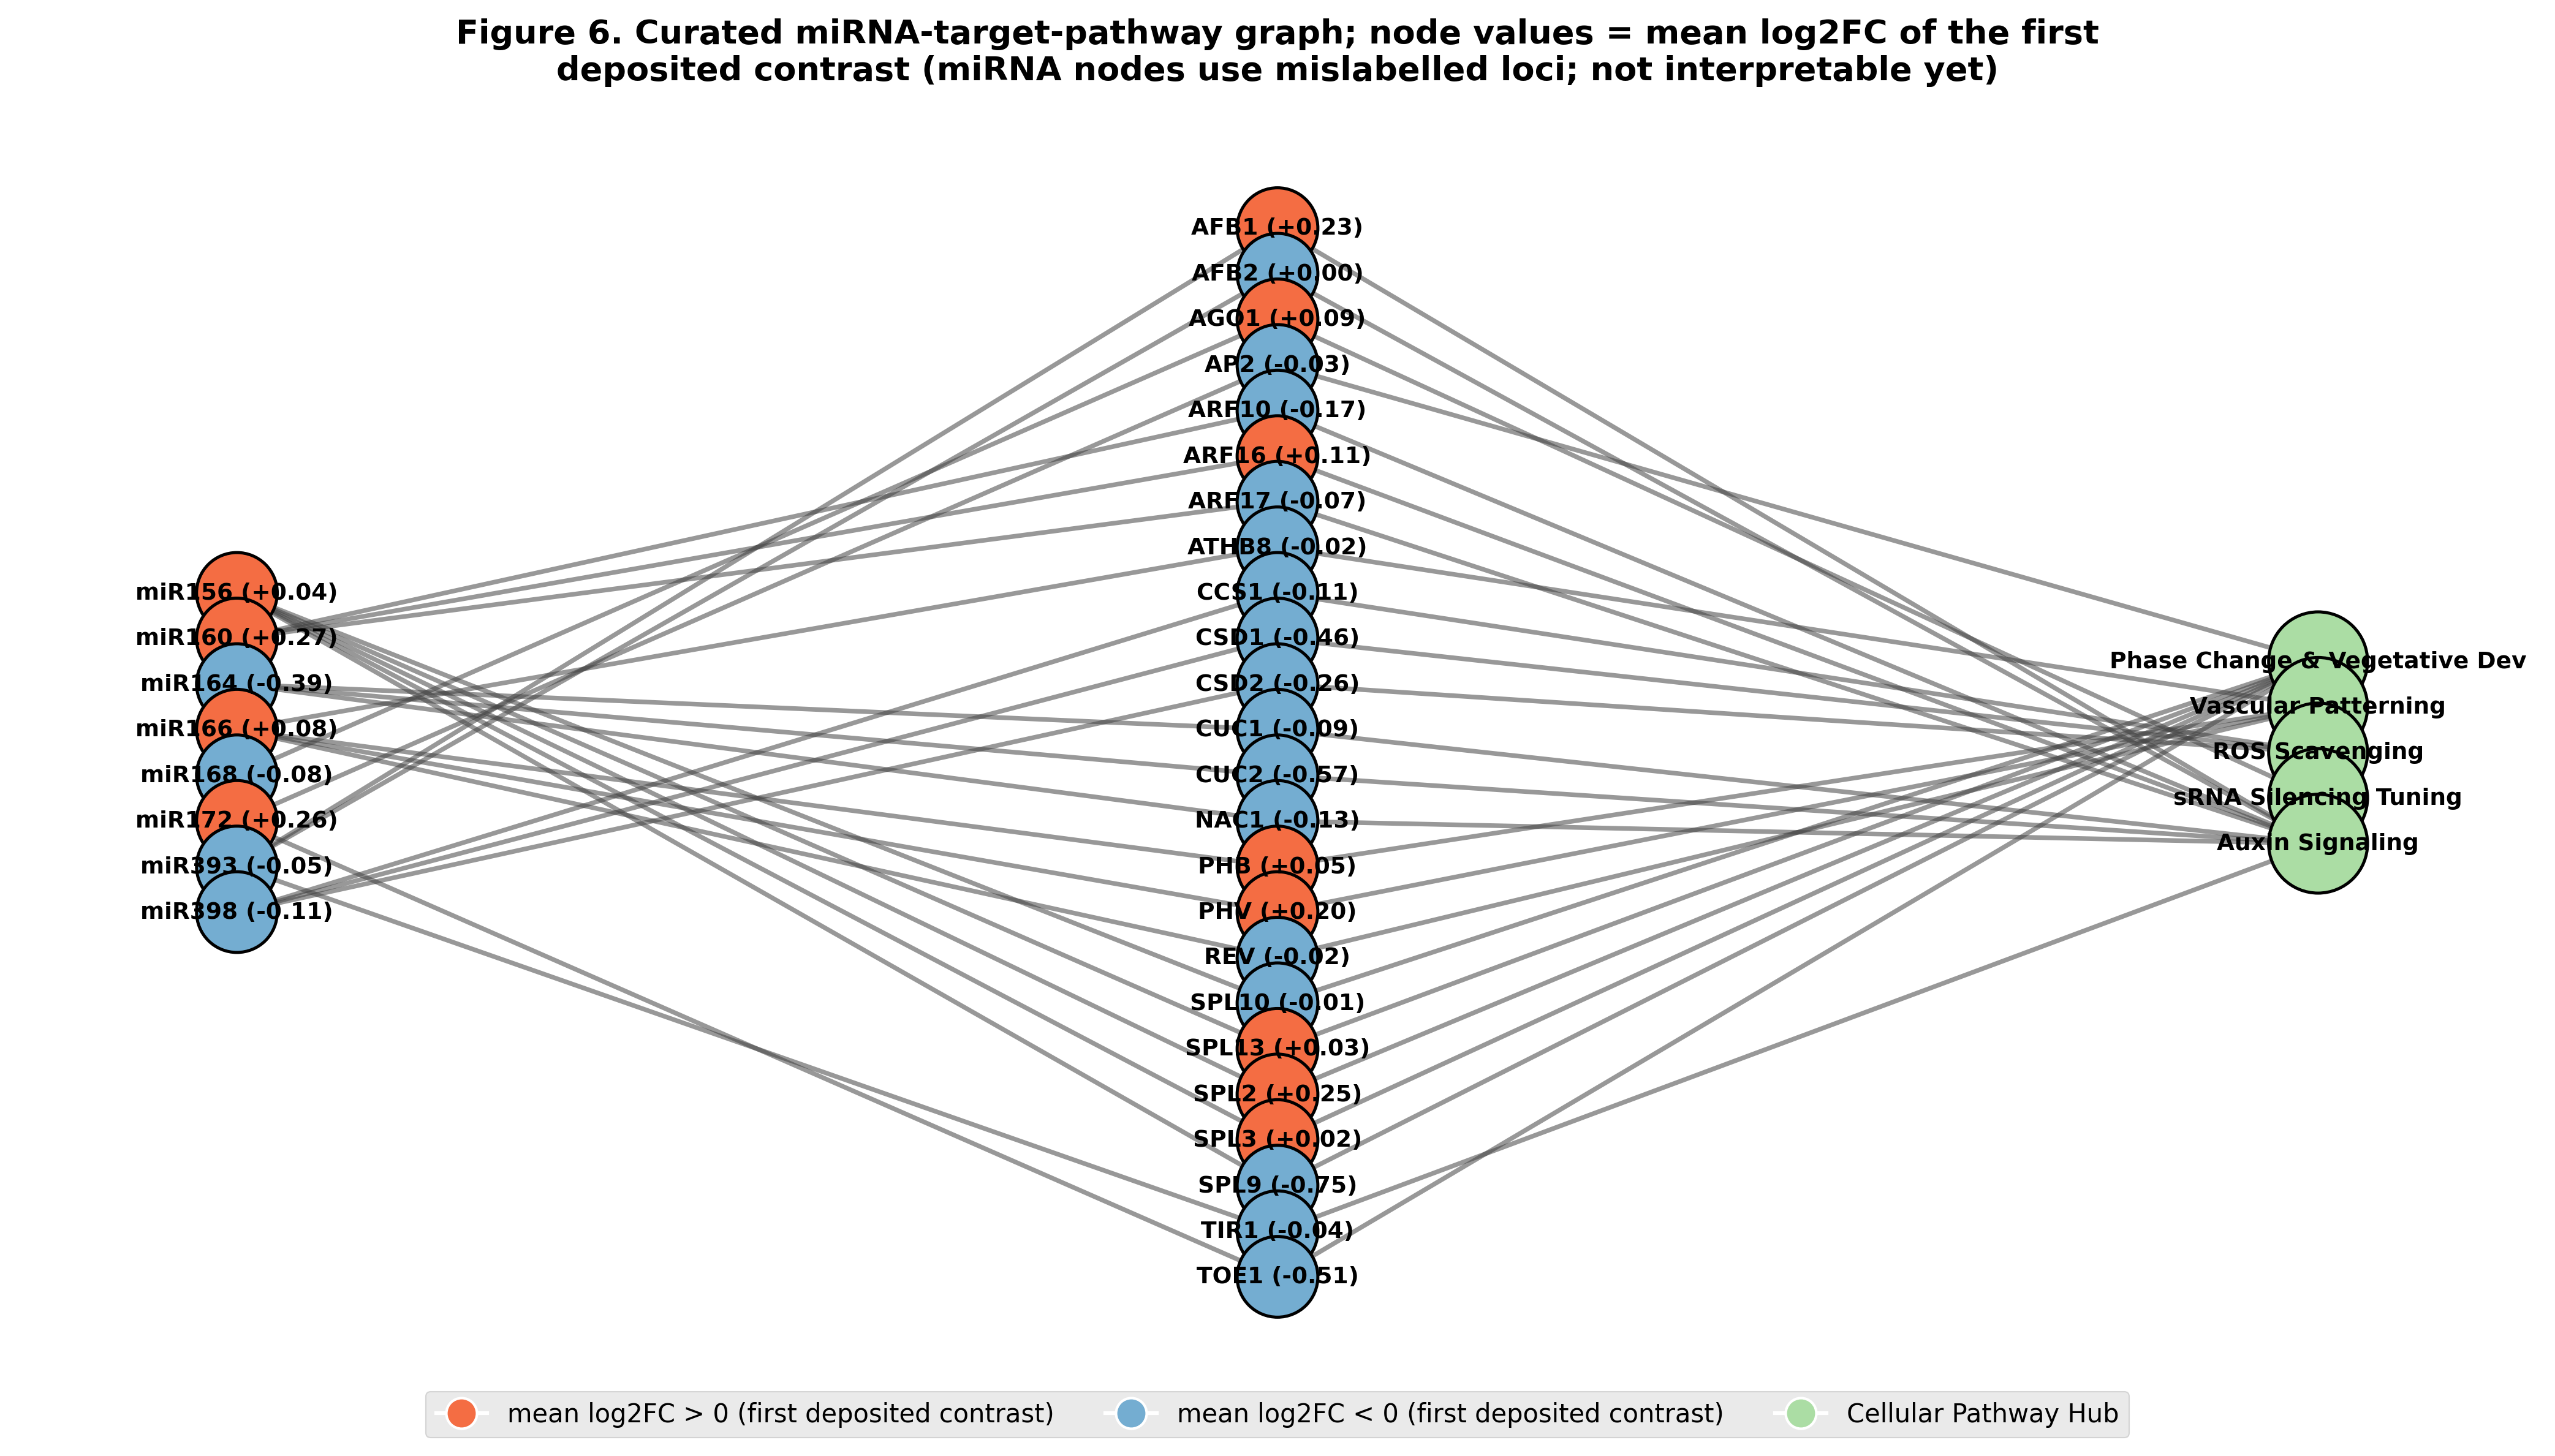
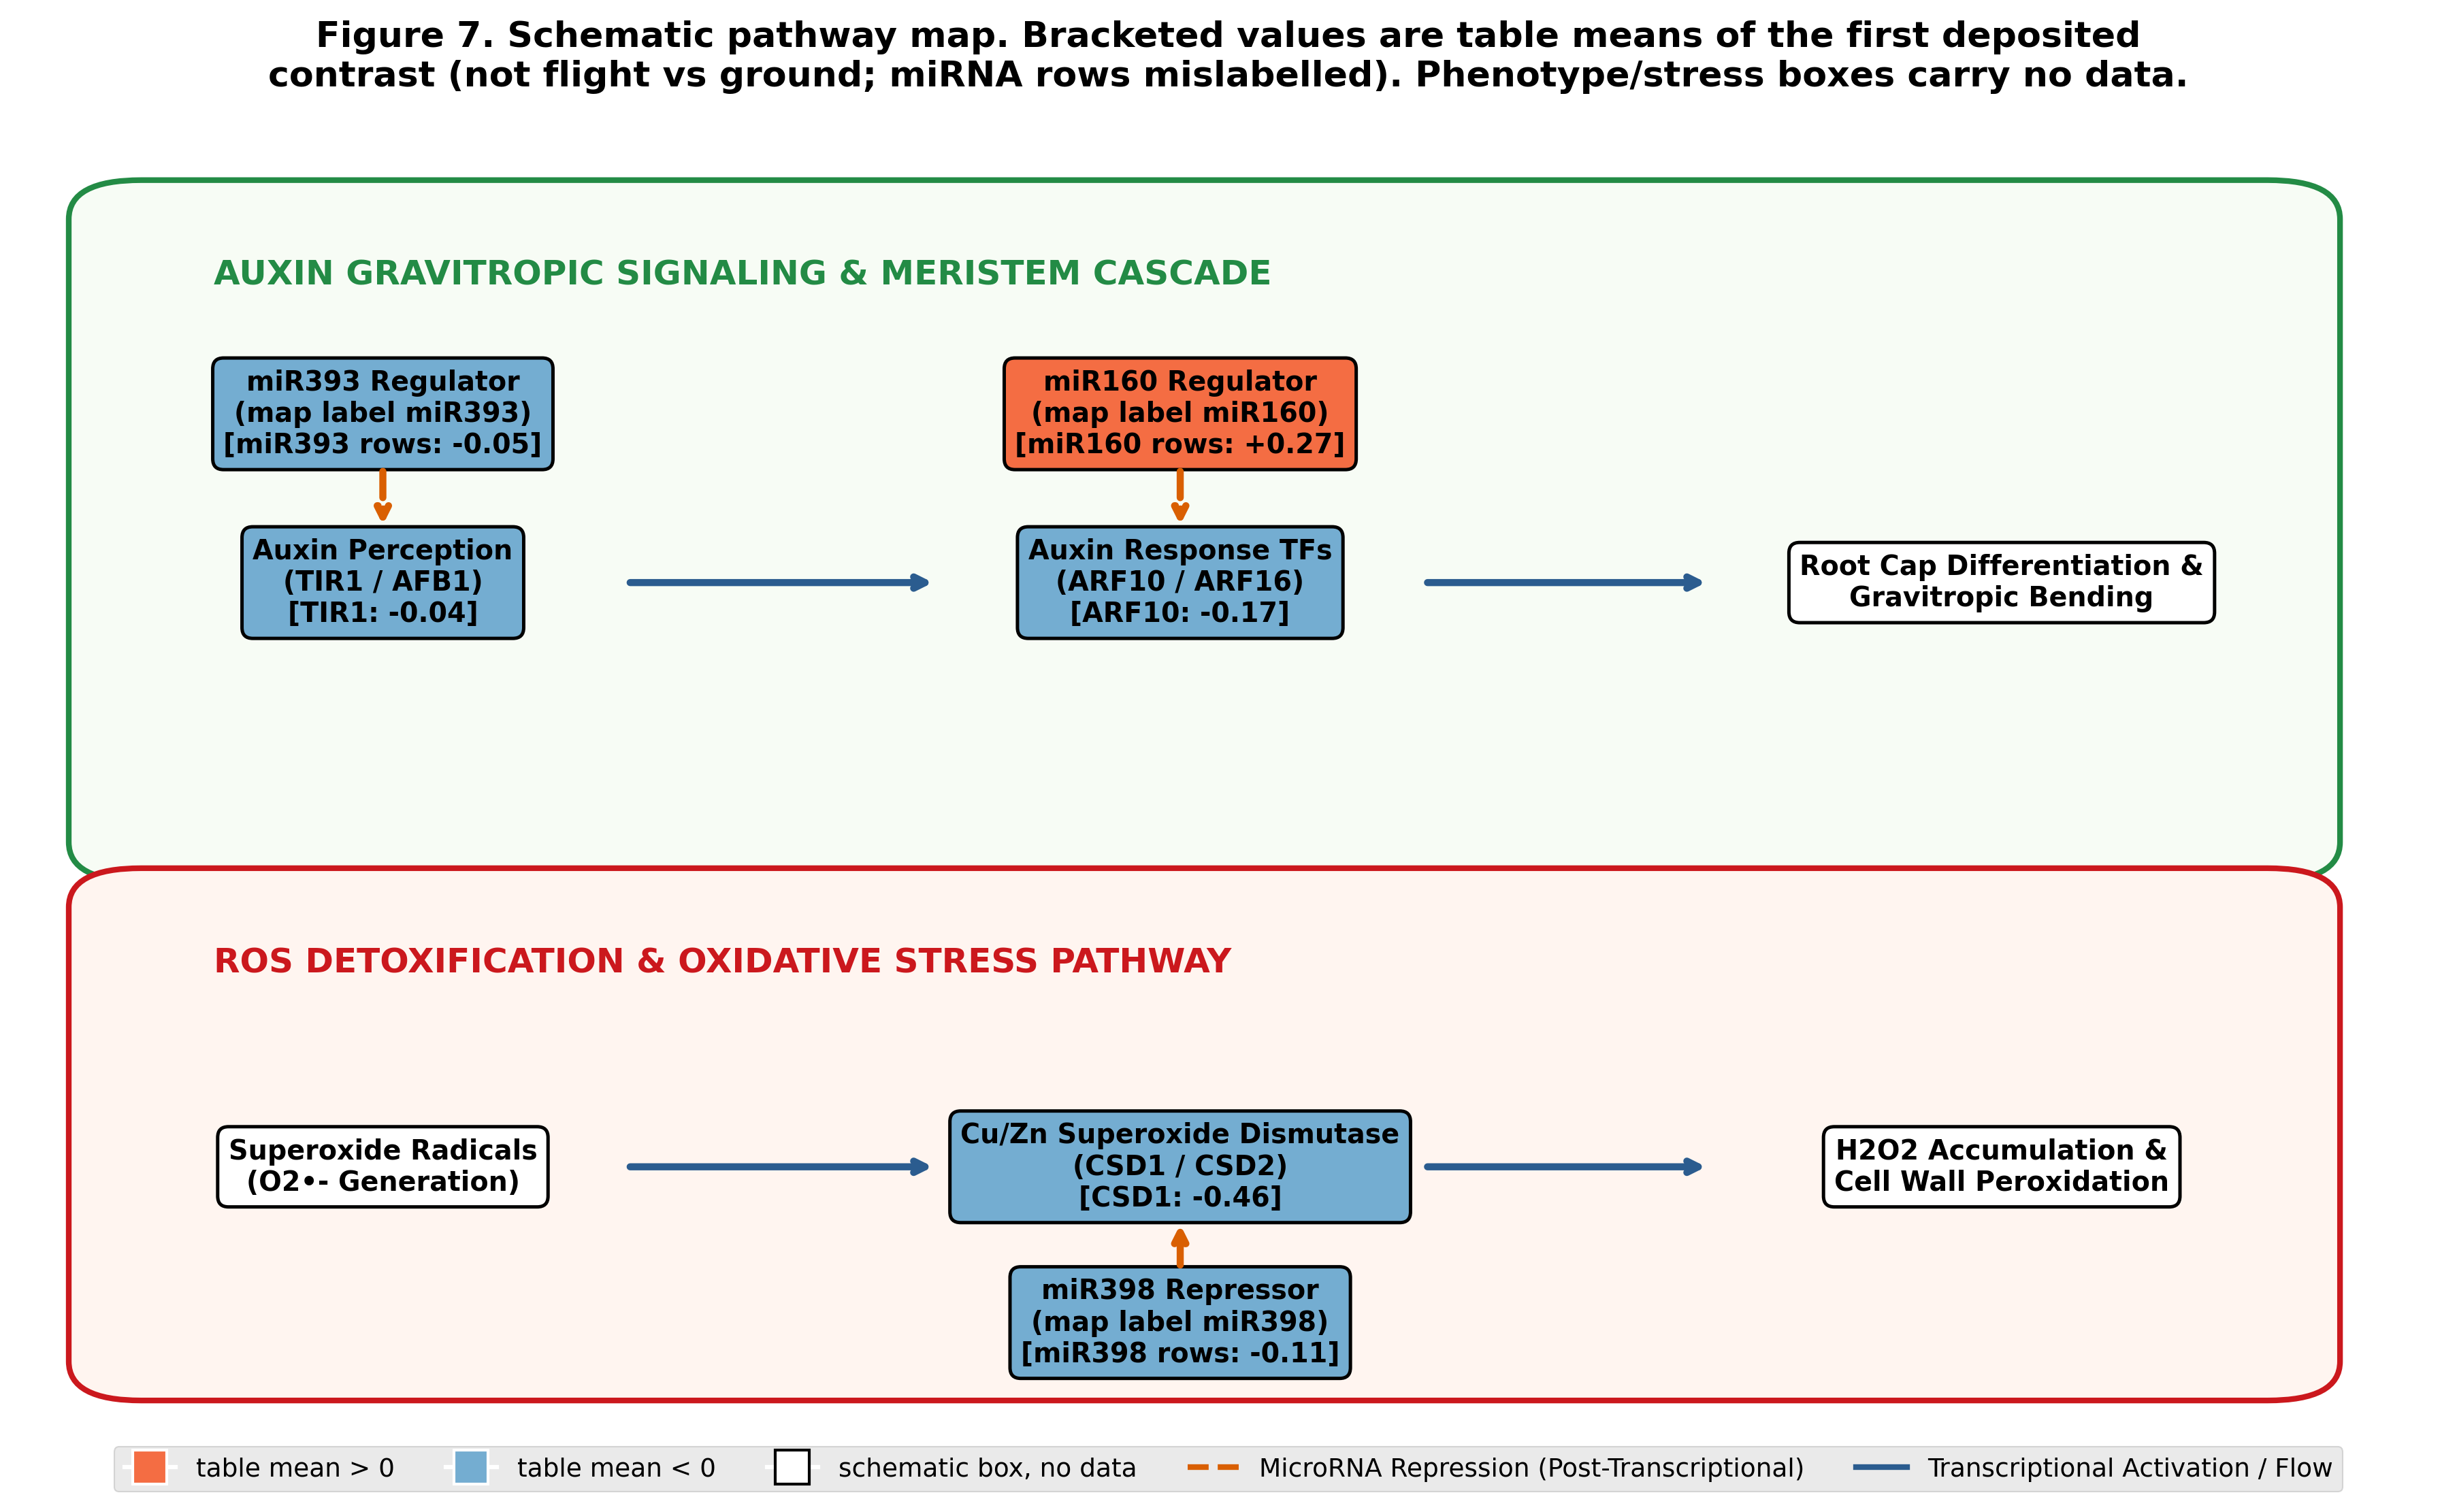
07Reproducibility & Data
The smallRNAseq-DREAM code is open source under the MIT License. All input data are public NASA OSDR datasets.
Pipeline Driver
Regenerates the inventory, the scan tables and Figures 1–7 from OSDR downloads:
python run_pipeline.py
Zenodo Deposit & Citation
Citation metadata are in .zenodo.json and CITATION.cff. A Zenodo deposit of the benchmark bundle is prepared but not yet made.
Zenodo DOI: pending