CAX2 is required for the Arabidopsis transcriptional response to spaceflight, uncoupling gene expression from root-growth remodelling
APEX-05 — Advanced Plant Experiment-05
Authors: [TO CONFIRM: author list, affiliations, ORCIDs] Corresponding author: [TO CONFIRM]
Manuscript status. This is the final integrated manuscript for the APEX-05 three-genotype analysis (Col-0, cax2-2, rbohD), built on the corrected 64-sample count matrix (
run1 v2.2 fix2). All quantitative results below are produced by the pipeline inanalysis/and are reproducible fromresults/.[TO CONFIRM]marks fields requiring author input (metadata, hardware, citations). The excluded fourth genotype (cax2-3) is documented indocs/cax2_allele_concordance.md.
Abstract
Spaceflight reprogrammes plant gene expression and growth, but the signalling components that translate the orbital environment into altered development remain incompletely defined. The Advanced Plant Experiment-05 (APEX-05) flew Arabidopsis thaliana — wild-type Col-0, a mutant in the calcium/H⁺ exchanger CAX2 (cax2-2), and a mutant in the NADPH oxidase RBOHD (rbohD) — on the International Space Station alongside matched ground controls, profiling the root and shoot transcriptome (RNA-seq) and root system architecture (RSML morphometrics) from the same plate wells. Differential expression (DESeq2, flight-referenced) showed that wild-type mounts a substantial flight response (root 284, shoot 168 differentially expressed genes, DEGs), corroborated by an independent L1-regularised (LASSO) classifier (100% leave-one-out accuracy; DEG-overlap p ≤ 10⁻¹²⁷). Projecting the bulk signal onto a published A. thaliana single-cell reference localised the wild-type and rbohD root response to the outer root — epidermis, cortex and the gravity-sensing columella — and implicated glutathione metabolism and phenylpropanoid biosynthesis; the response most resembled hypoxia, oxidative and defence stress programmes. Strikingly, cax2-2 almost entirely abolished the transcriptional flight response (root 5, shoot 3 DEGs; ~5× smaller flight axis than wild-type), identifying CAX2 as required for normal spaceflight transcriptional reprogramming. Yet spaceflight still shortened cax2-2 roots comparably to wild-type, uncoupling the transcriptional and morphological flight responses. We release APEX-05 as a FAIR, reproducible data-and-code package integrating transcriptomics, root imaging and a machine-learning analysis layer.
Introduction
[Scaffold — expand with citations.]
- The problem. Plants are candidate life-support organisms for long-duration spaceflight, but microgravity perturbs gravitropism, hydrotropism, oxidative balance and cell-wall processes. Prior spaceflight transcriptomics (GeneLab / OSDR corpus) established broad reprogramming; the causal signalling nodes remain debated. [TO CONFIRM: citations.]
- Candidate pathways. Calcium signalling — including vacuolar Ca²⁺/H⁺ exchange by CAX2 — and reactive-oxygen production by the NADPH oxidase RBOHD are central to plant environmental sensing and proposed as early relays of the spaceflight response. APEX-05 tested their contribution by flying cax2-2 and rbohD against Col-0. [TO CONFIRM: prior hypotheses / allele line identifiers.]
- This study. We report the paired root/shoot transcriptome and root- architecture response of the three genotypes, integrate them through a well-level multi-omics join and a machine-learning analysis layer, and package the analysis to FAIR standards.
Results
1. A corrected, position-paired 64-sample design
RNA-seq counts (33,602 genes × 64 libraries) span four genotypes × four plate
wells × two tissues (root, shoot) × two conditions (spaceflight FL, ground
control GC). Each well contributes matched FL and GC libraries, a position-
paired design established from the ALSDA sample metadata via the sequencing
S-numbers (analysis/ml/apex05_data.py); this well key also joins each library
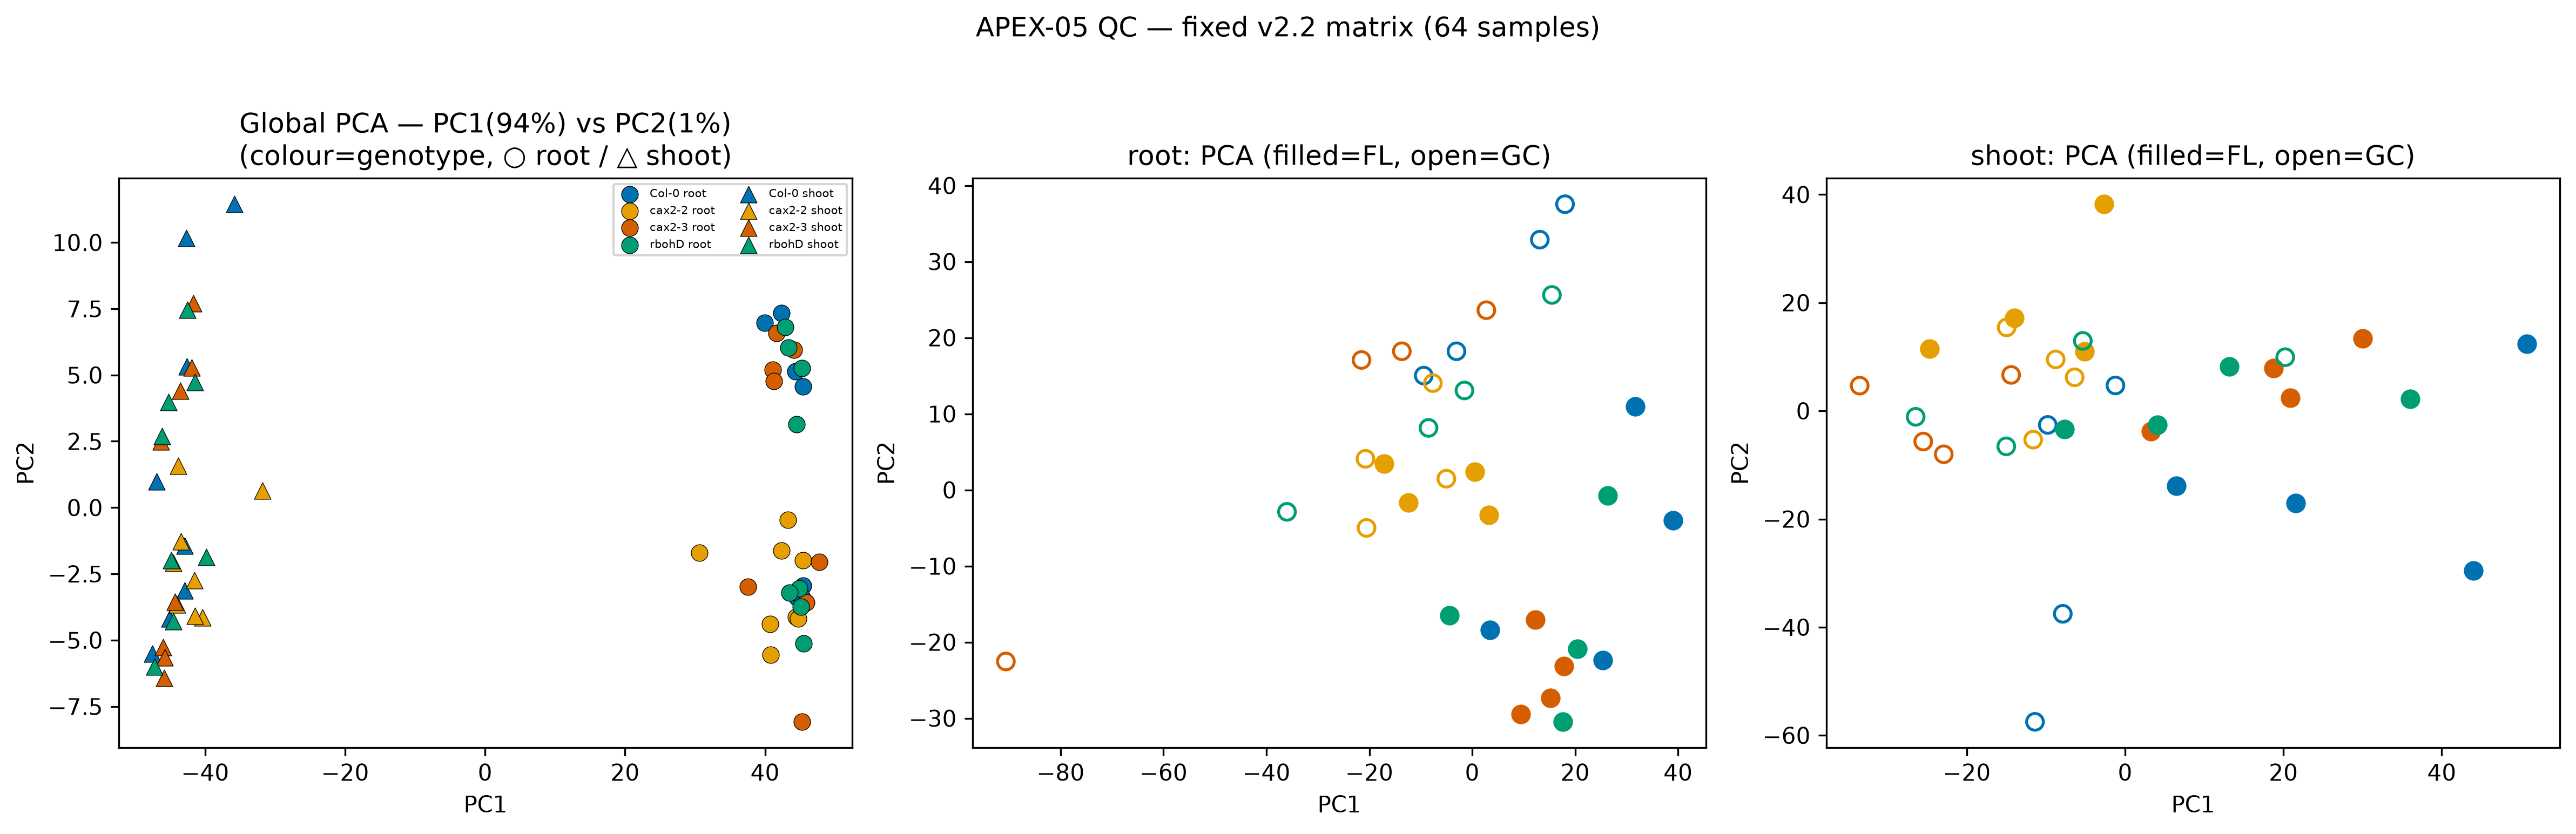
to its RSML root image. A global principal-component analysis was clean — PC1
(94% of variance) separated root from shoot with no outlying libraries (Fig. 1) —
supporting the corrected sample assignments. Directions throughout are
flight-referenced (positive = induced by spaceflight).
(The fourth flown genotype, the independent CAX2 allele cax2-3, was excluded
after a concordance analysis showed its flight-DEG set inflated ~90–100× relative
to cax2-2 with an outlier library — the signature of a technical artefact
rather than allelic biology; see docs/cax2_allele_concordance.md, Fig. S1.)
2. Wild-type mounts a robust flight response that CAX2 is required for
DESeq2 (FL vs GC per genotype × tissue; FDR < 0.05, |log₂FC| > 1) detected a substantial wild-type response — Col-0 root 284 DEGs (201 induced / 83 repressed), shoot 168 (156 / 12) — and a comparable rbohD response (root 280, shoot 33; Table 1, Fig. 2). In sharp contrast, cax2-2 showed almost no transcriptional flight response: 5 root and 3 shoot DEGs (15 / 4 even at a relaxed 1.5-fold, FDR < 0.1 threshold), and its FL-vs-GC separation in morphometric-blind PCA was ~5× smaller than wild-type's (Cohen-scaled centroid distance 7.9 vs 39.9 in root; Fig. 1). Because the sample QC was clean, this is a genuine biological attenuation, not a data-quality artefact: CAX2 is required for the normal spaceflight transcriptional response.
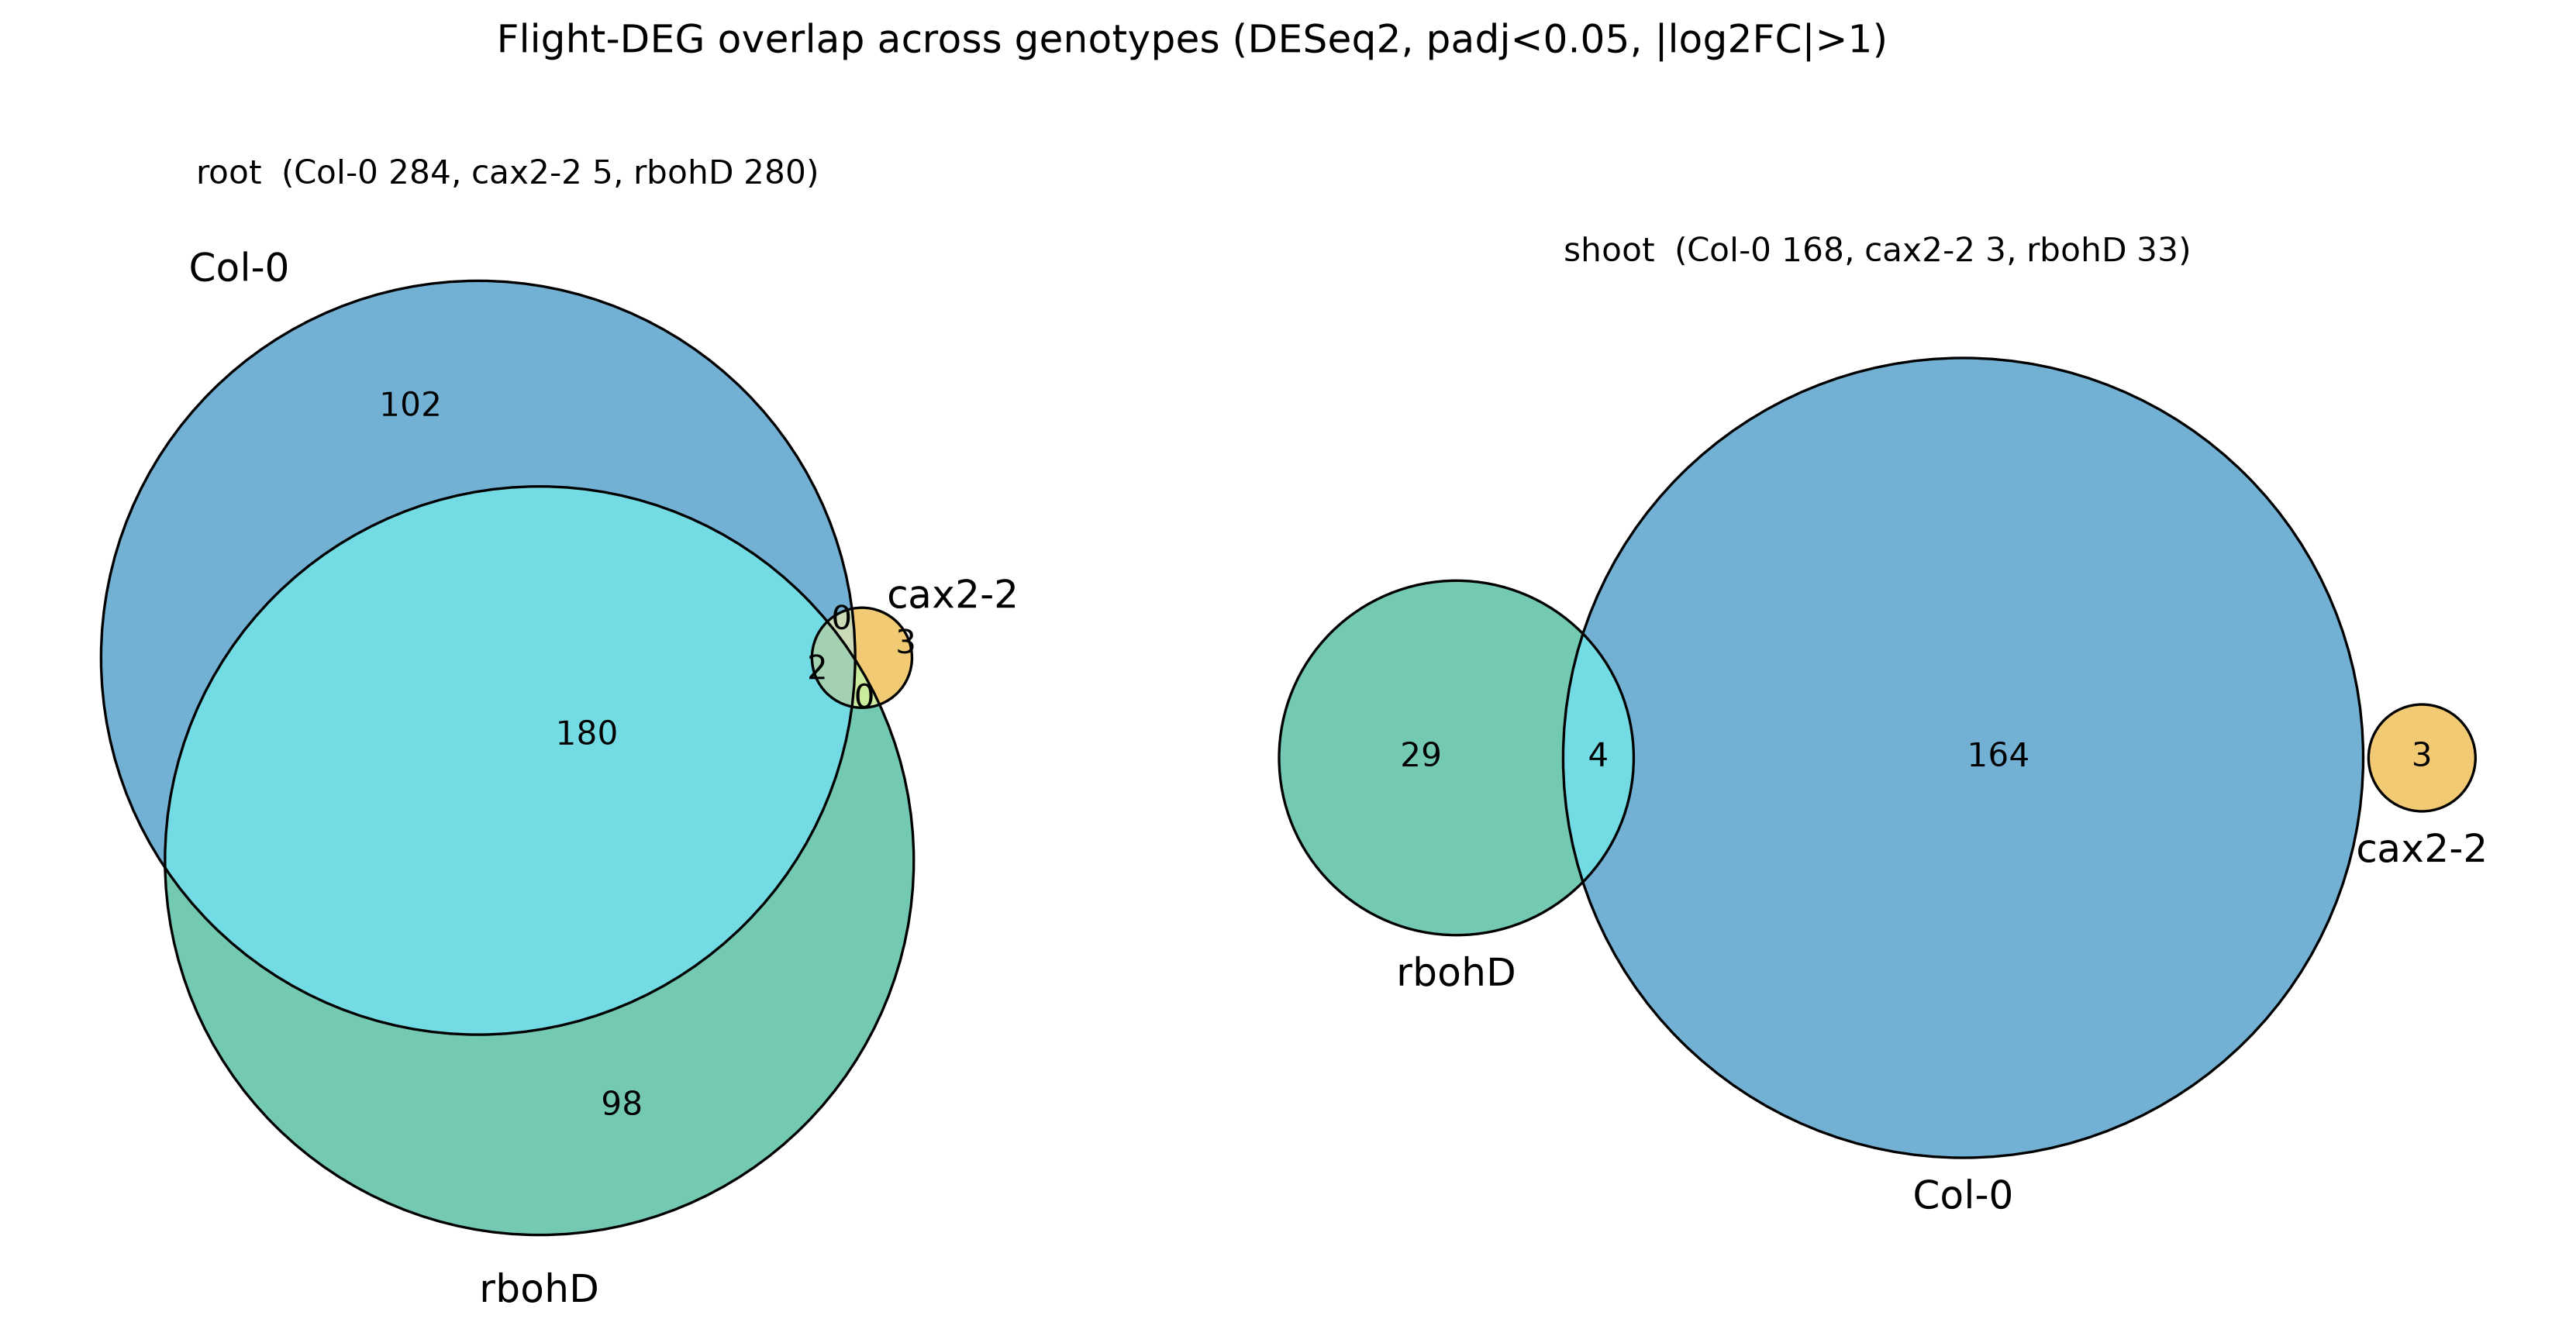
Wild type and rbohD converge on a shared 180-gene root flight core (of 284
and 280 DEGs respectively; Fig. S5), whereas cax2-2 contributes essentially
nothing to it (only 2 genes shared by all three genotypes) — i.e. the canonical
root flight programme is largely intact in rbohD but abolished in cax2-2. The
shoot response is more genotype-specific (Col-0 ∩ rbohD = 4 genes). Region
membership is in results/tables/apex05_deg_overlap_membership.csv.
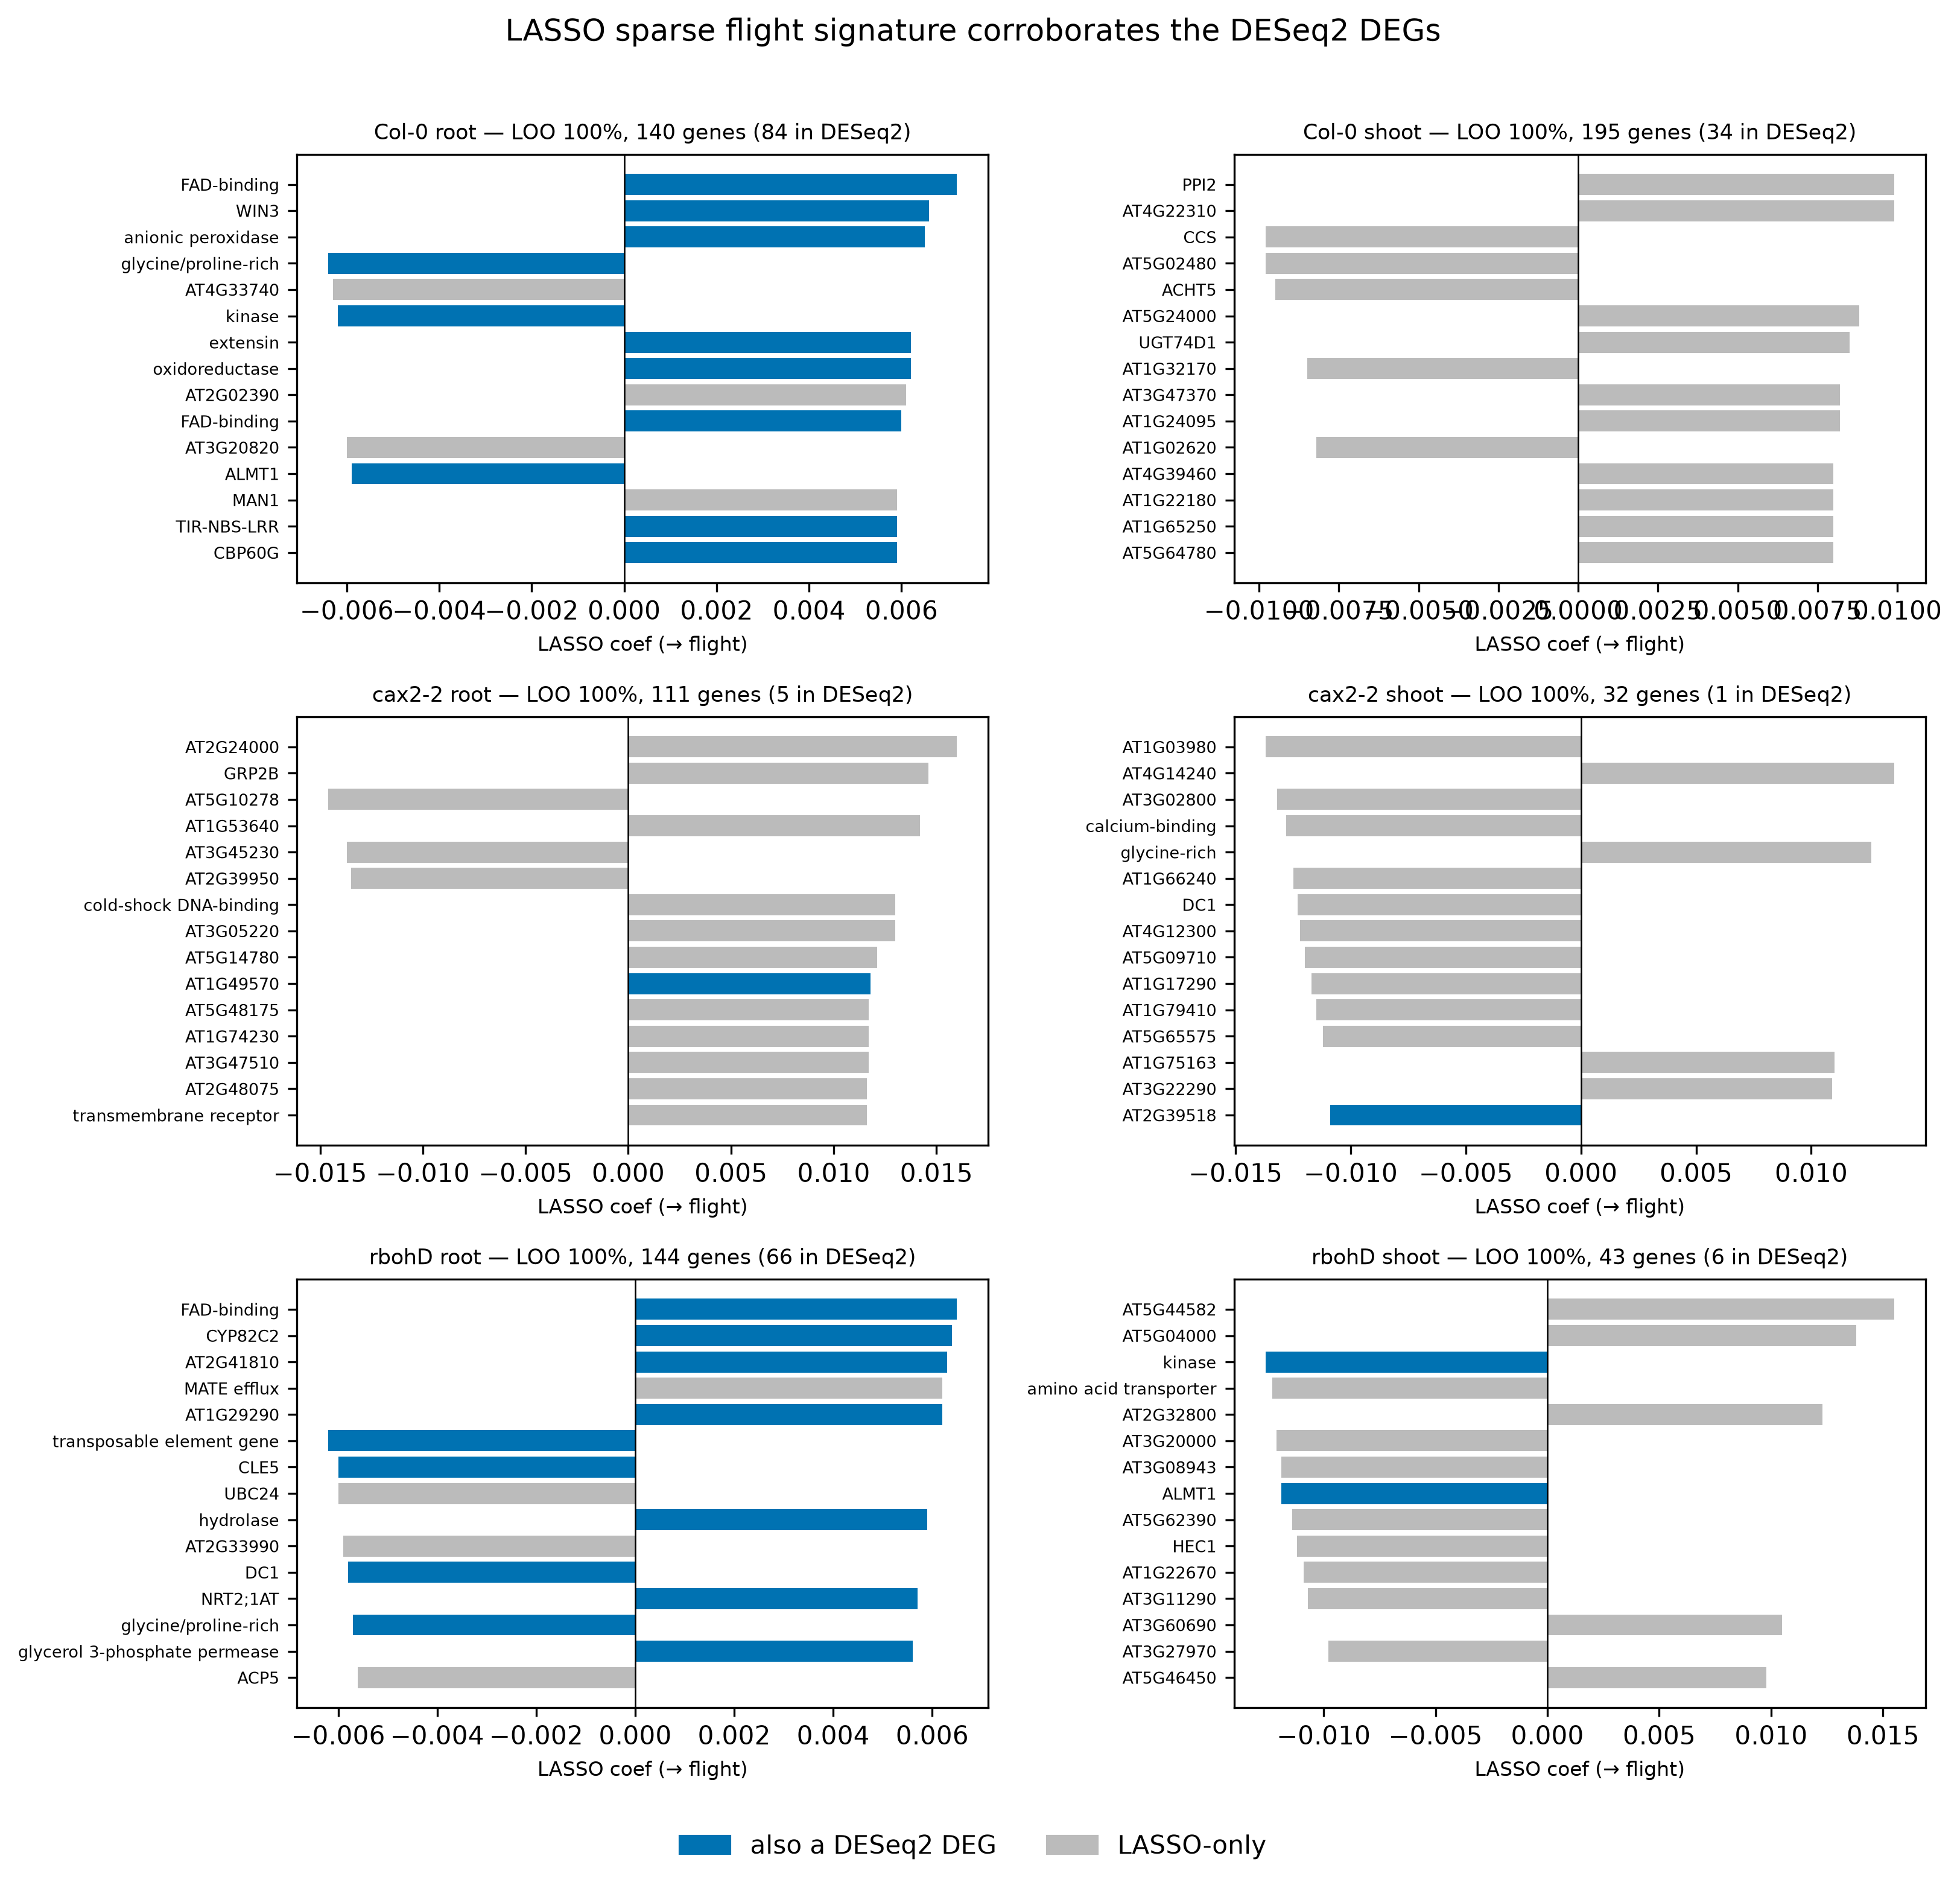
An independent machine-learning check corroborated the DESeq2 calls
(analysis/ml/apex05_lasso_flight_signature.py, Fig. 3). A stability-selected
LASSO logistic classifier separated FL from GC at 100% leave-one-out accuracy in
every genotype, but the trustworthy quantity — overlap of the LASSO signature
with the DESeq2 DEGs — was strong for Col-0 and rbohD (hypergeometric p up to
10⁻¹²⁷) and minimal for cax2-2 (5/111 root genes), mirroring its near-absent
differential expression.
3. The wild-type flight response localises to the outer root and the gravity-sensing columella
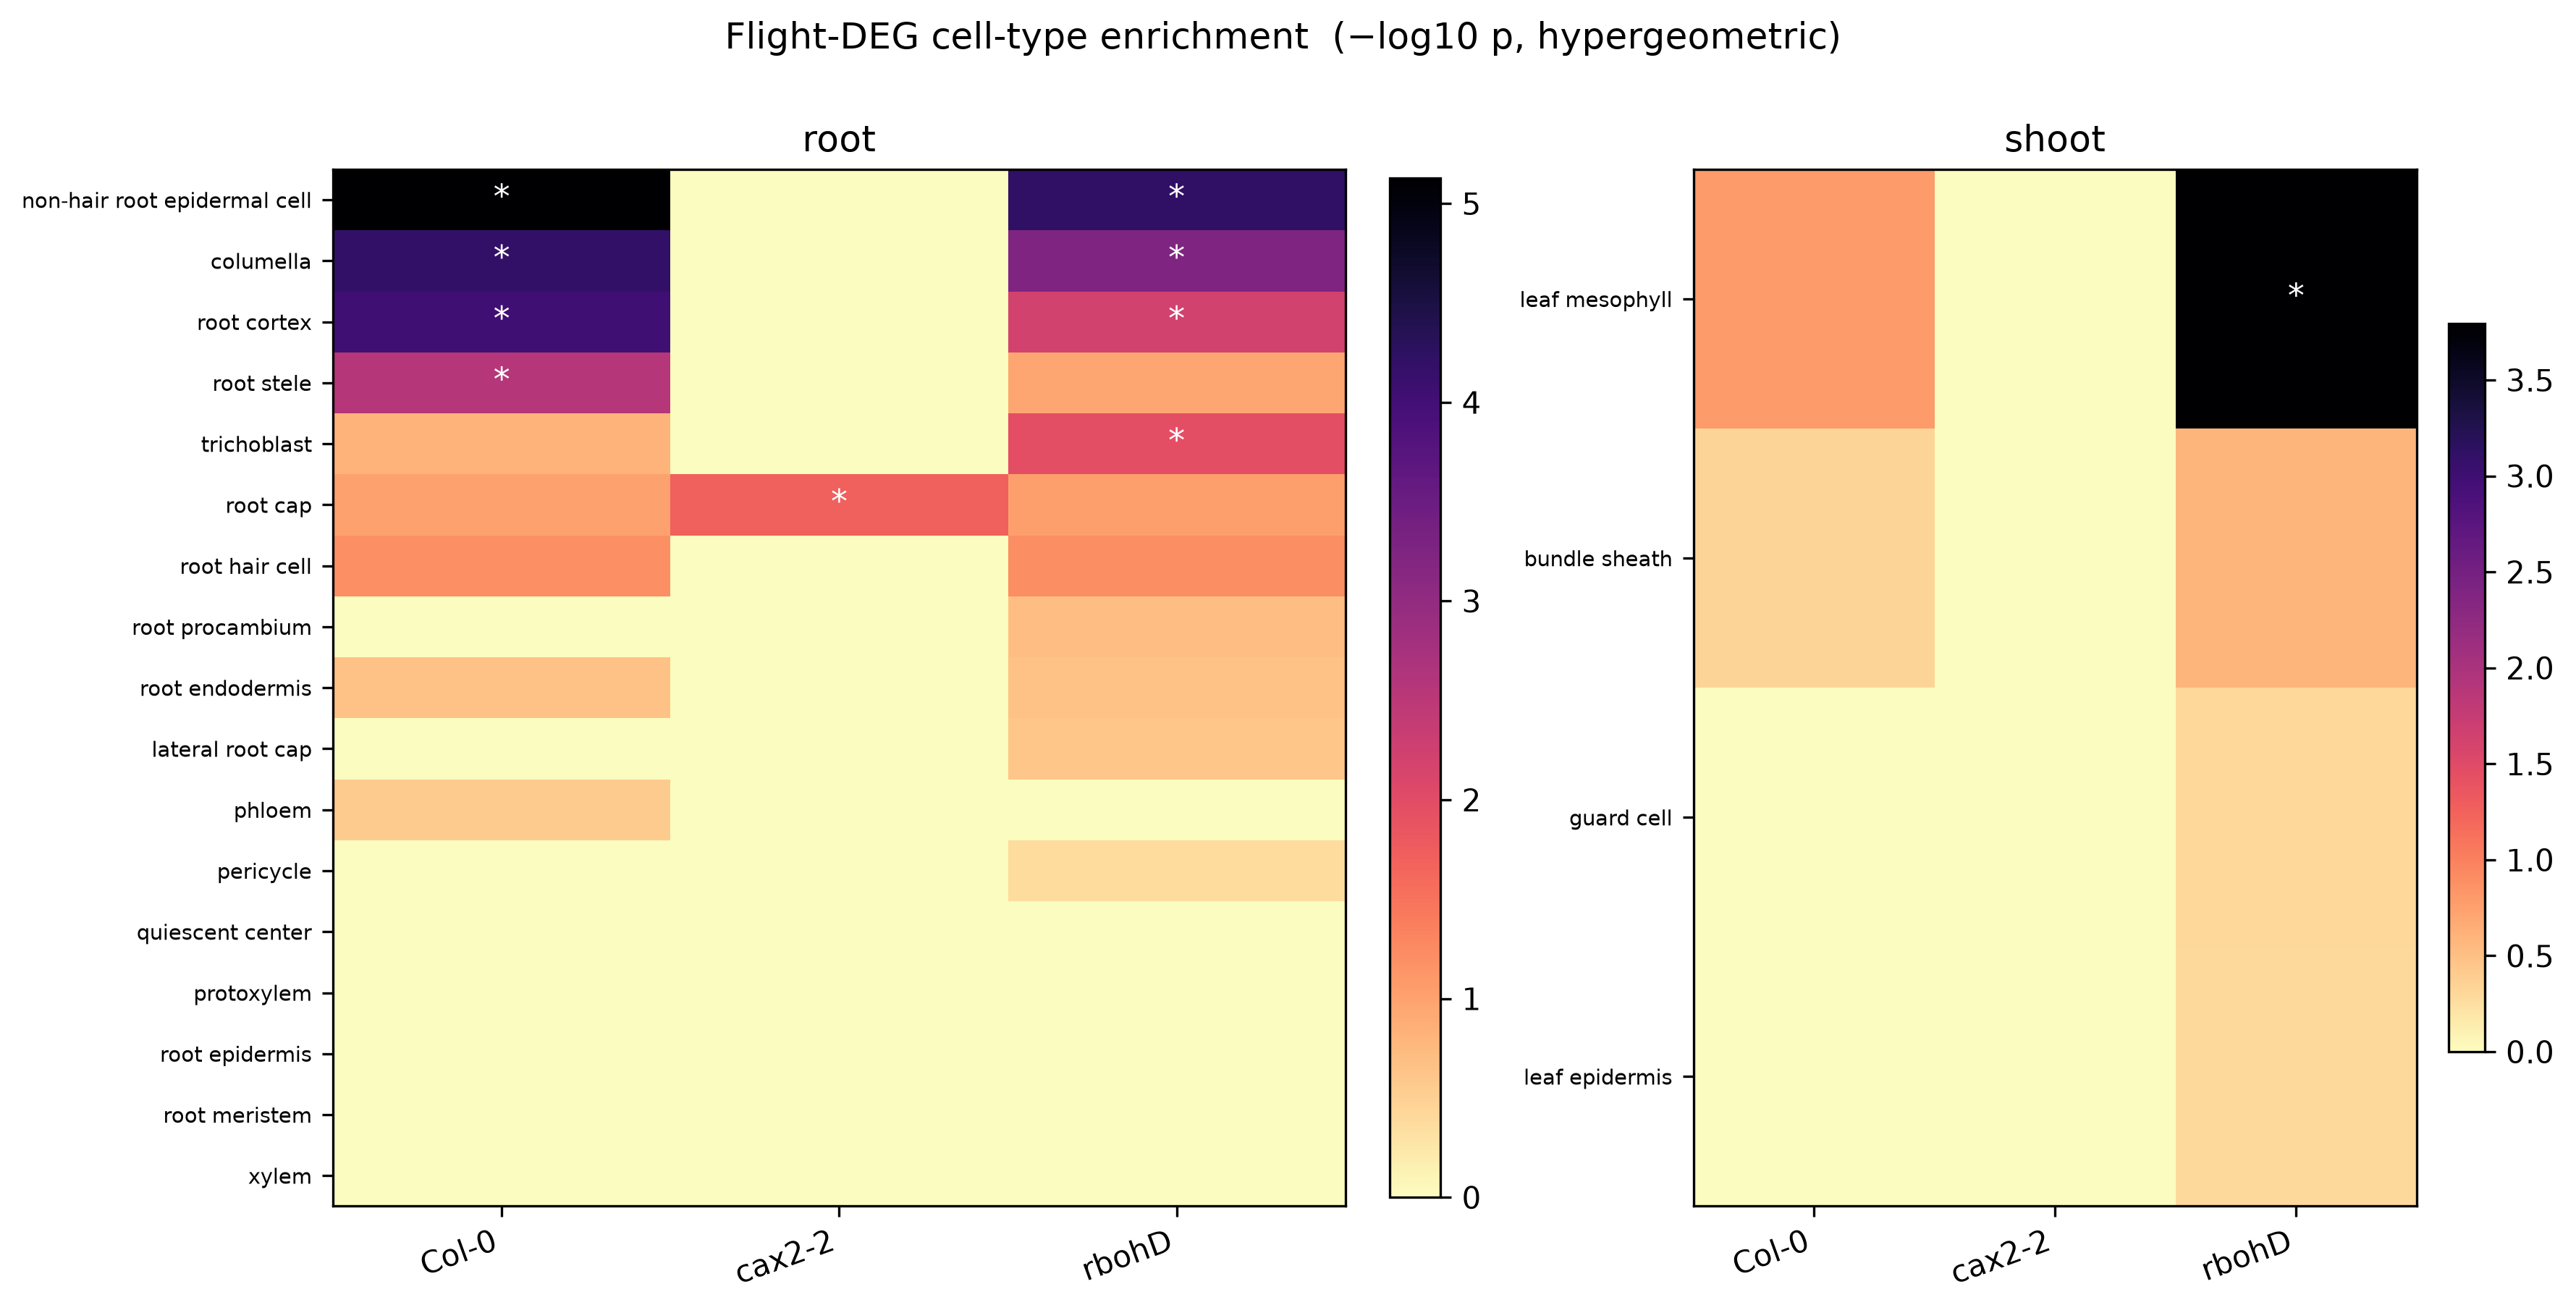
Because APEX-05 is bulk RNA-seq, we resolved the response to cell types by
projecting the DEGs onto a published A. thaliana single-cell marker reference
(Plant Cell Marker DataBase, PCMDB; analysis/ml/apex05_celltype_projection.py,
Fig. 4). The wild-type and rbohD root responses were significantly enriched for
markers of the non-hair epidermis, cortex and columella (Col-0 also stele;
hypergeometric p = 8×10⁻⁶ to 10⁻³), with the rbohD shoot response enriched for
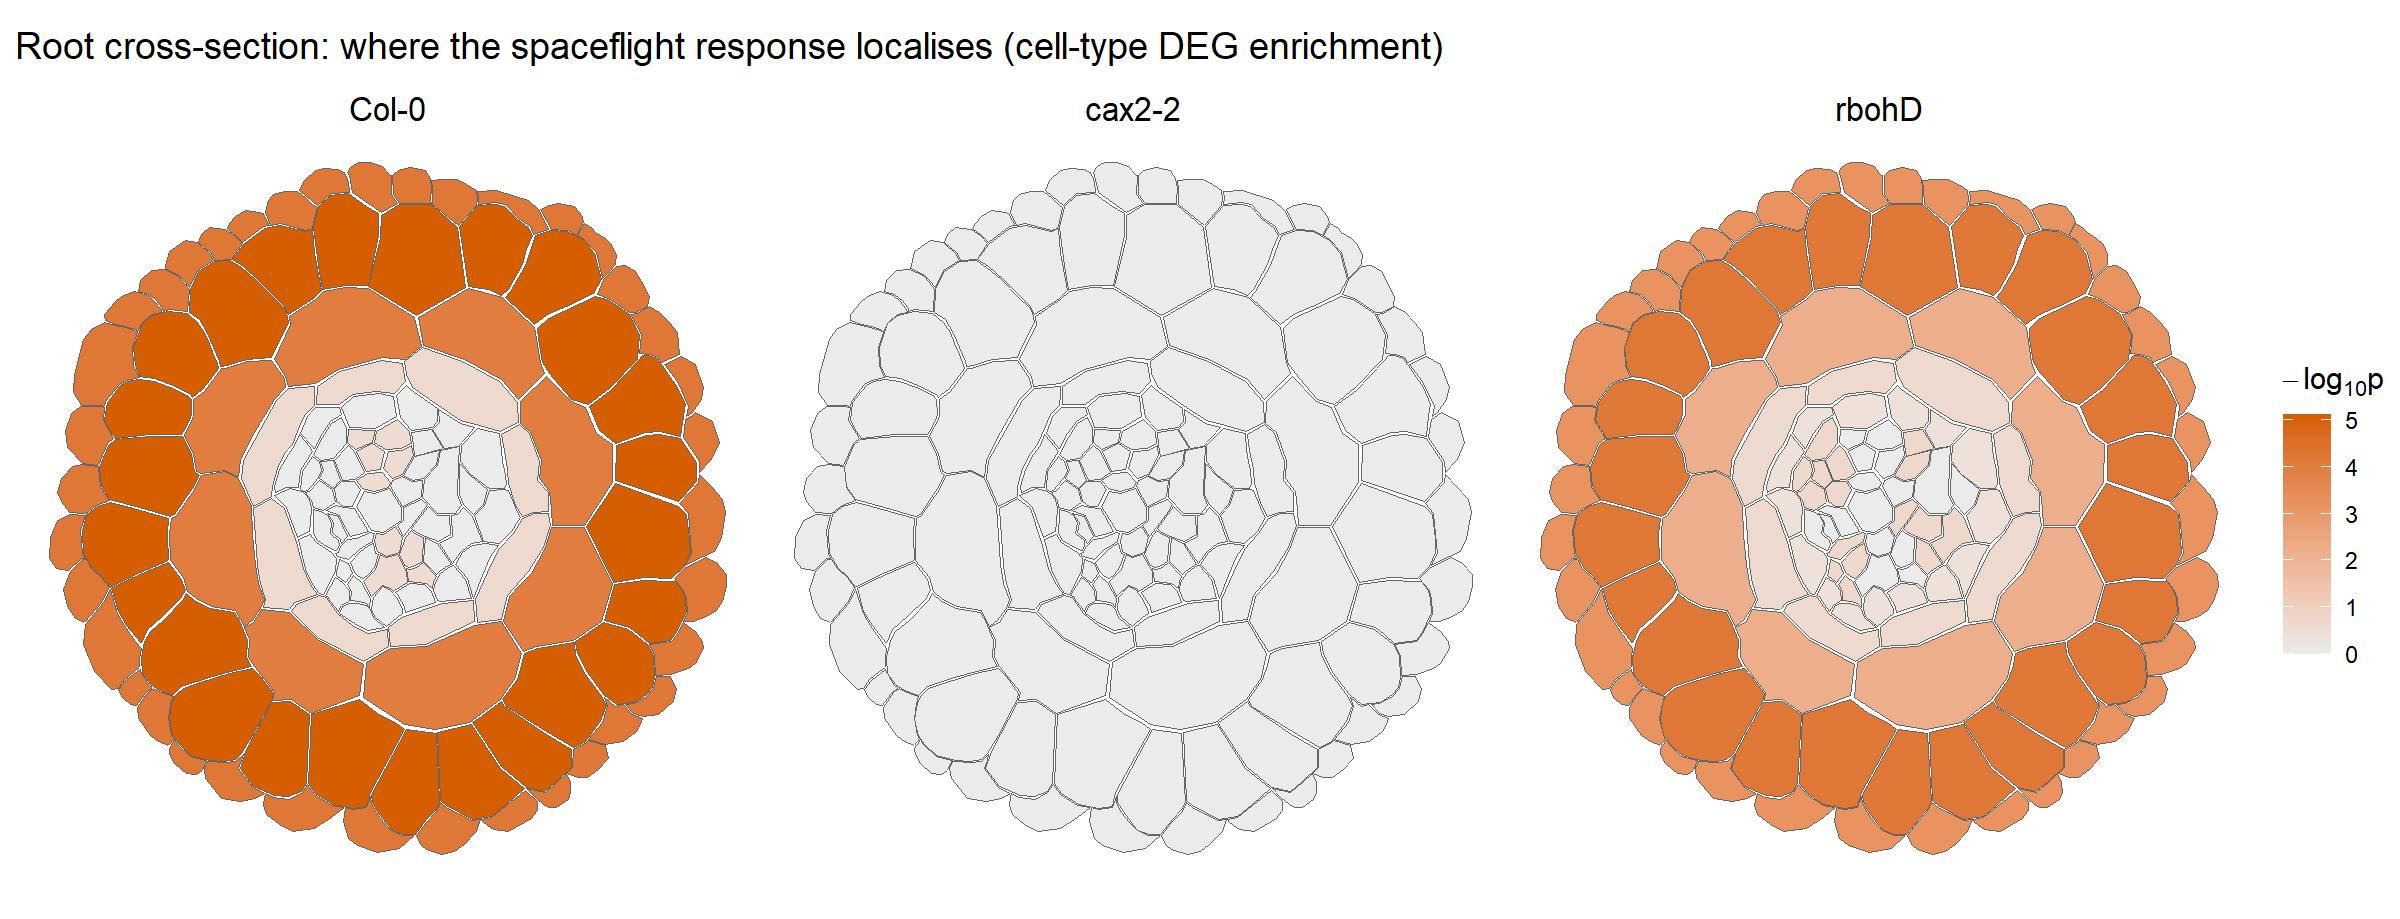
leaf mesophyll. Painted onto root anatomy with ggPlantmap
(analysis/R/apex05_ggplantmap_anatomy.R, Fig. 5), the response occupies the
outer root layers in Col-0 and rbohD and is blank in cax2-2. The
enrichment of the columella — the root's gravity-sensing statolith tissue — is
notable for a microgravity experiment.
4. Spaceflight remodels root architecture in all genotypes, uncoupling expression from growth
From the same wells, day-4 primary-root morphometrics (many seedlings per
genotype) showed that spaceflight significantly shortened roots and reduced root
surface and volume in every genotype (length/vector-length/surface/volume
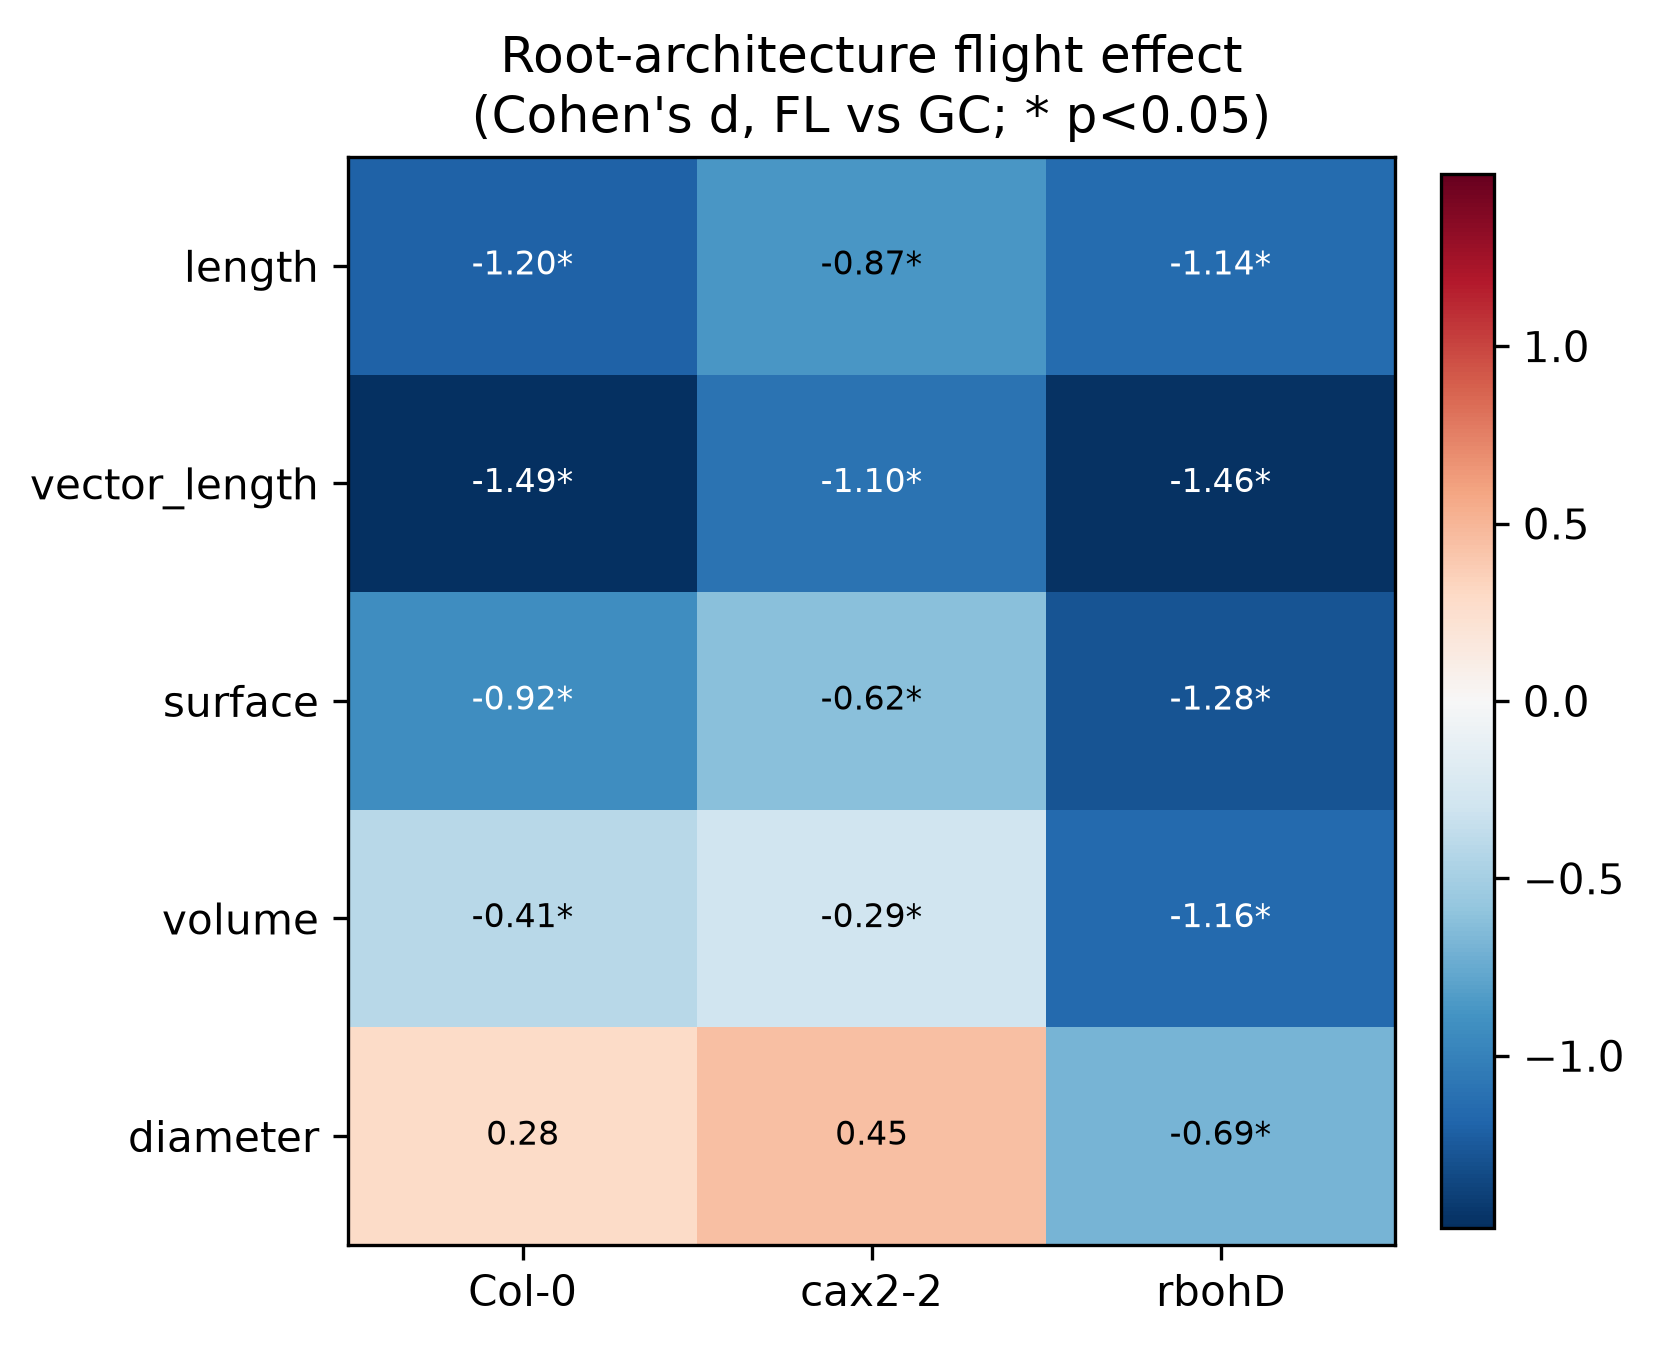
Cohen's d ≈ −0.3 to −1.5, all p < 0.05; rbohD strongest and also thinner,
diameter d = −0.69; Fig. 6). Integrating the two modalities per well
(analysis/ml/apex05_multiomics_integration.py) revealed a key dissociation:
although cax2-2 is the weakest responder in both assays, its transcriptome is
disproportionately attenuated relative to its retained root-shortening (root
DEGs 5 vs Col-0 284, but morphometric mean |d| 0.67 vs 0.86). Thus in cax2-2
the morphological flight response proceeds largely without the transcriptional
one — CAX2 is required chiefly for the transcriptional arm of the response.
The position-paired design allowed this dissociation to be tested at finer
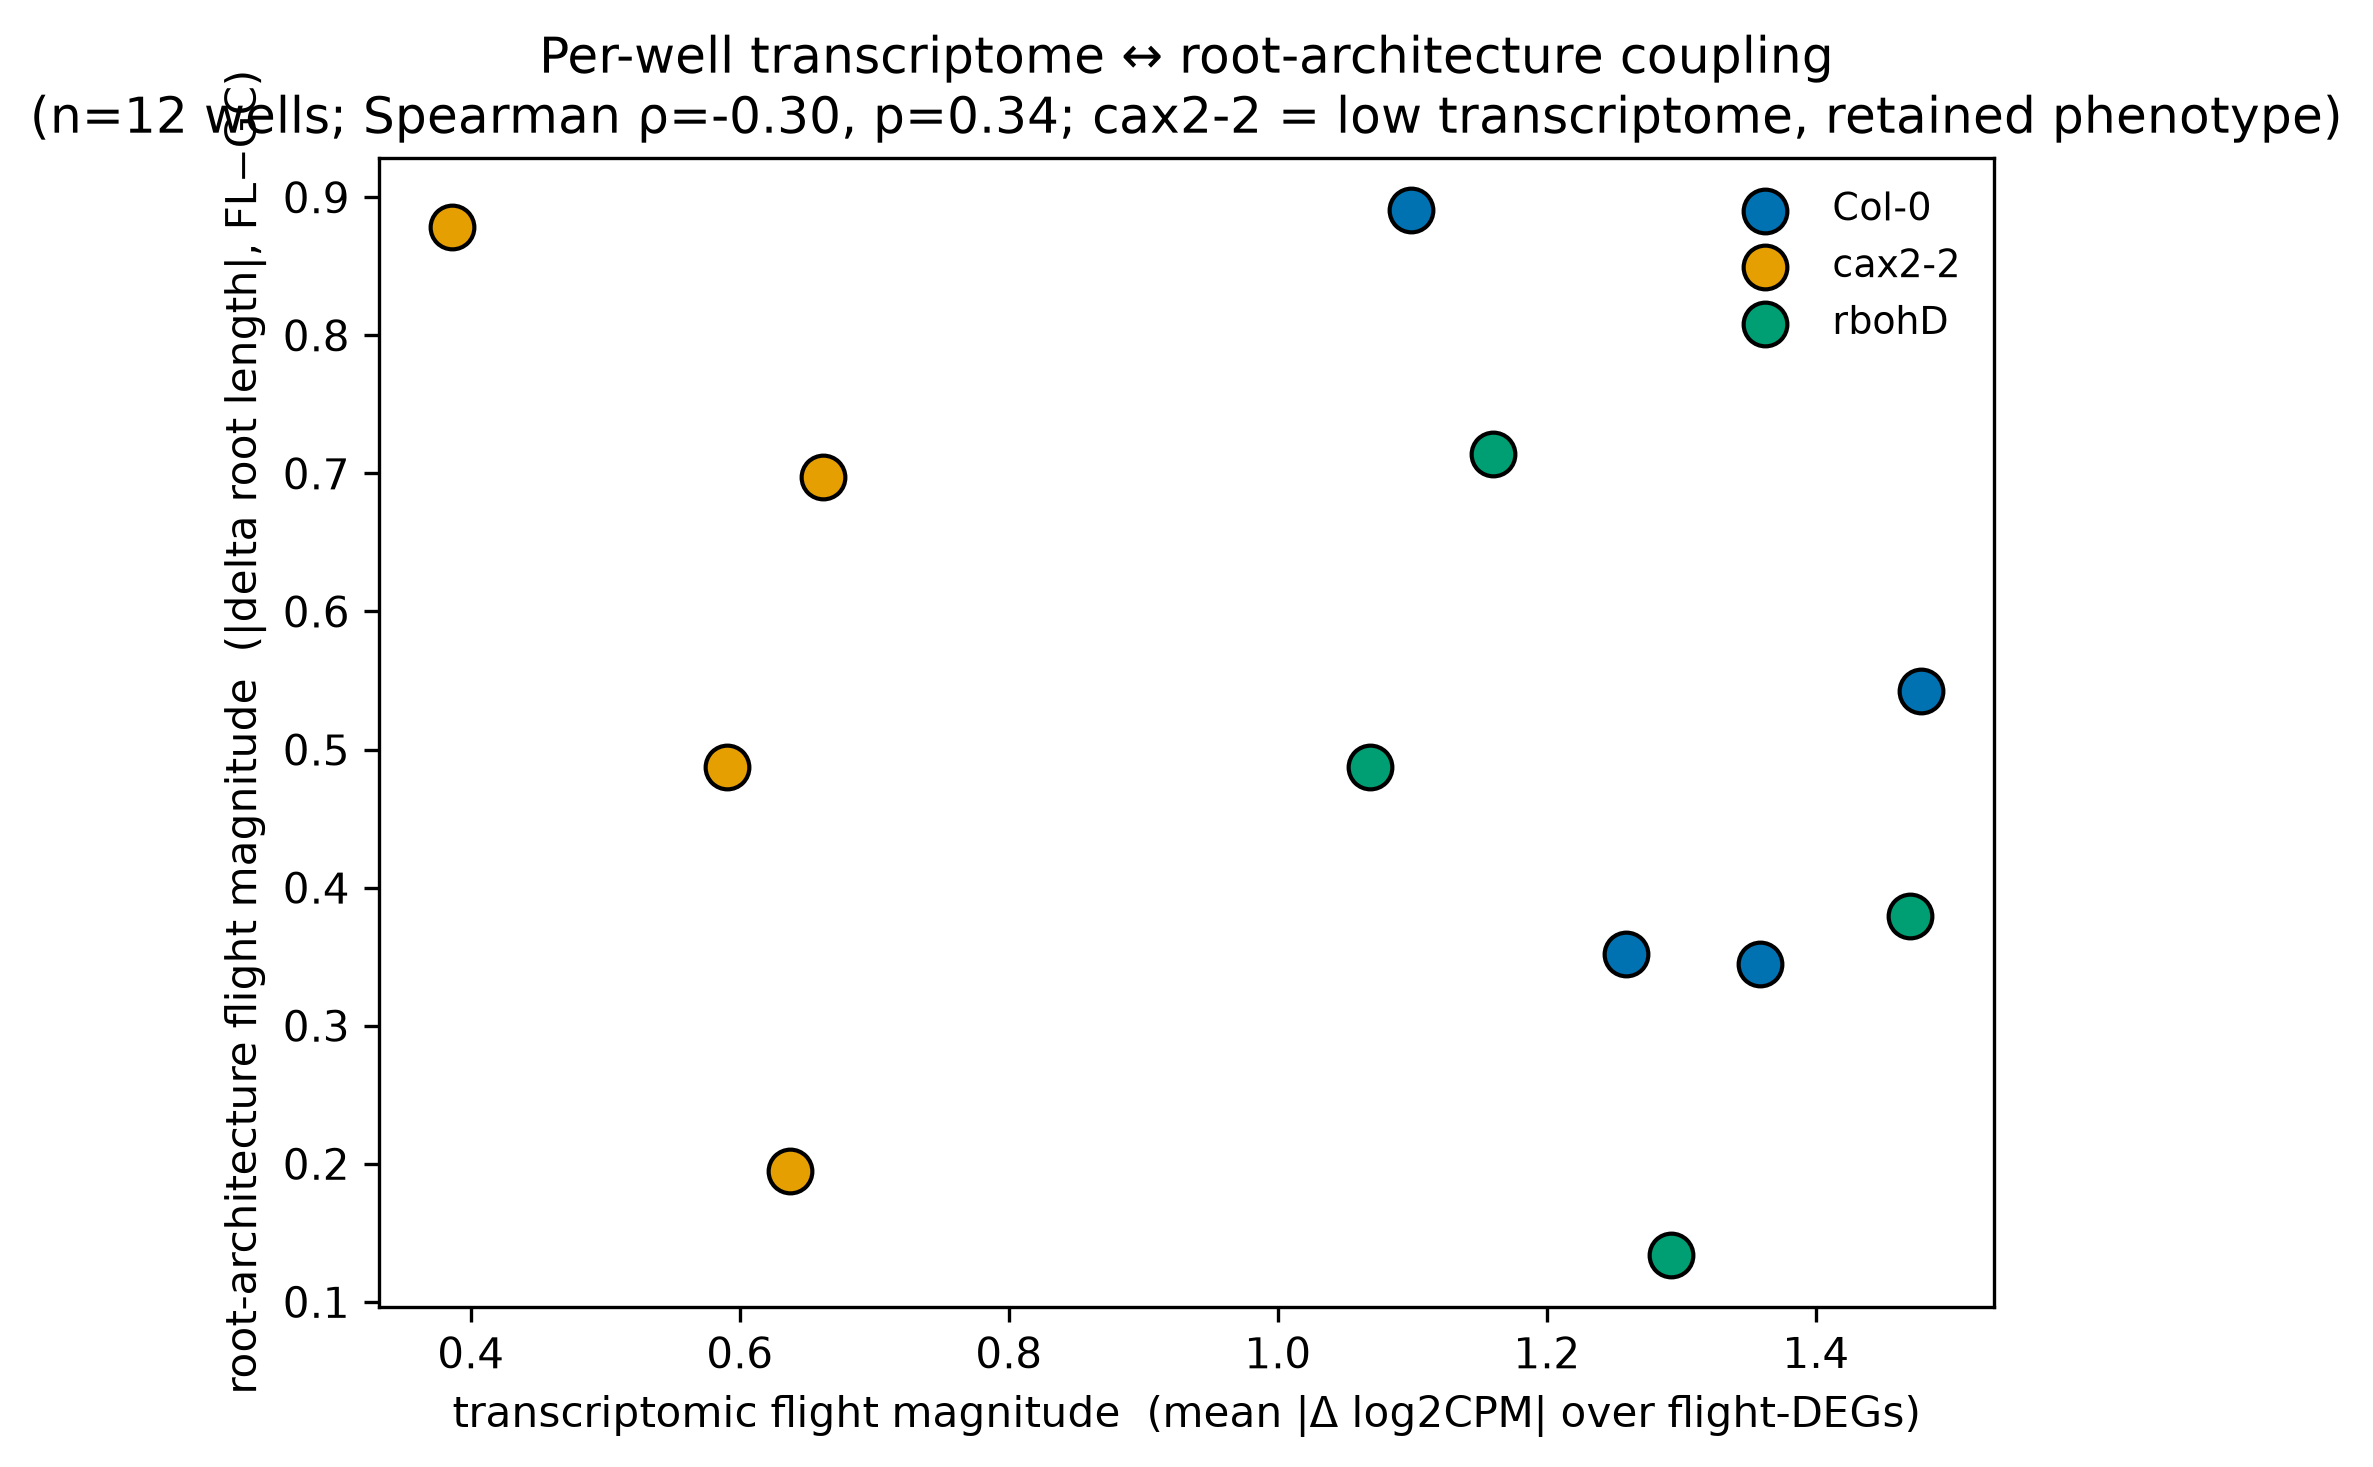
resolution (analysis/ml/apex05_rnaseq_rsml_geneintegration.py, Fig. 6c): across
the 12 primary-genotype root wells, the per-well transcriptomic flight magnitude
(mean |Δlog₂CPM| over the flight-DEG panel, FL−GC) and the per-well root-shortening
(|Δ root length|) were not correlated (Spearman ρ = −0.30, p = 0.34), and no
individual flight-DEG's per-well expression change tracked root-shortening after
FDR correction (0 / 385 genes at BH-FDR < 0.1). The transcriptomic axis cleanly
separated cax2-2 (low) from Col-0/rbohD (high), whereas root-shortening
overlapped across all three — confirming, at well and gene resolution, that the
spaceflight root-growth response is largely uncoupled from the measured
transcriptional response.
5. The flight response resembles hypoxia, oxidative and defence stress and engages glutathione and phenylpropanoid metabolism
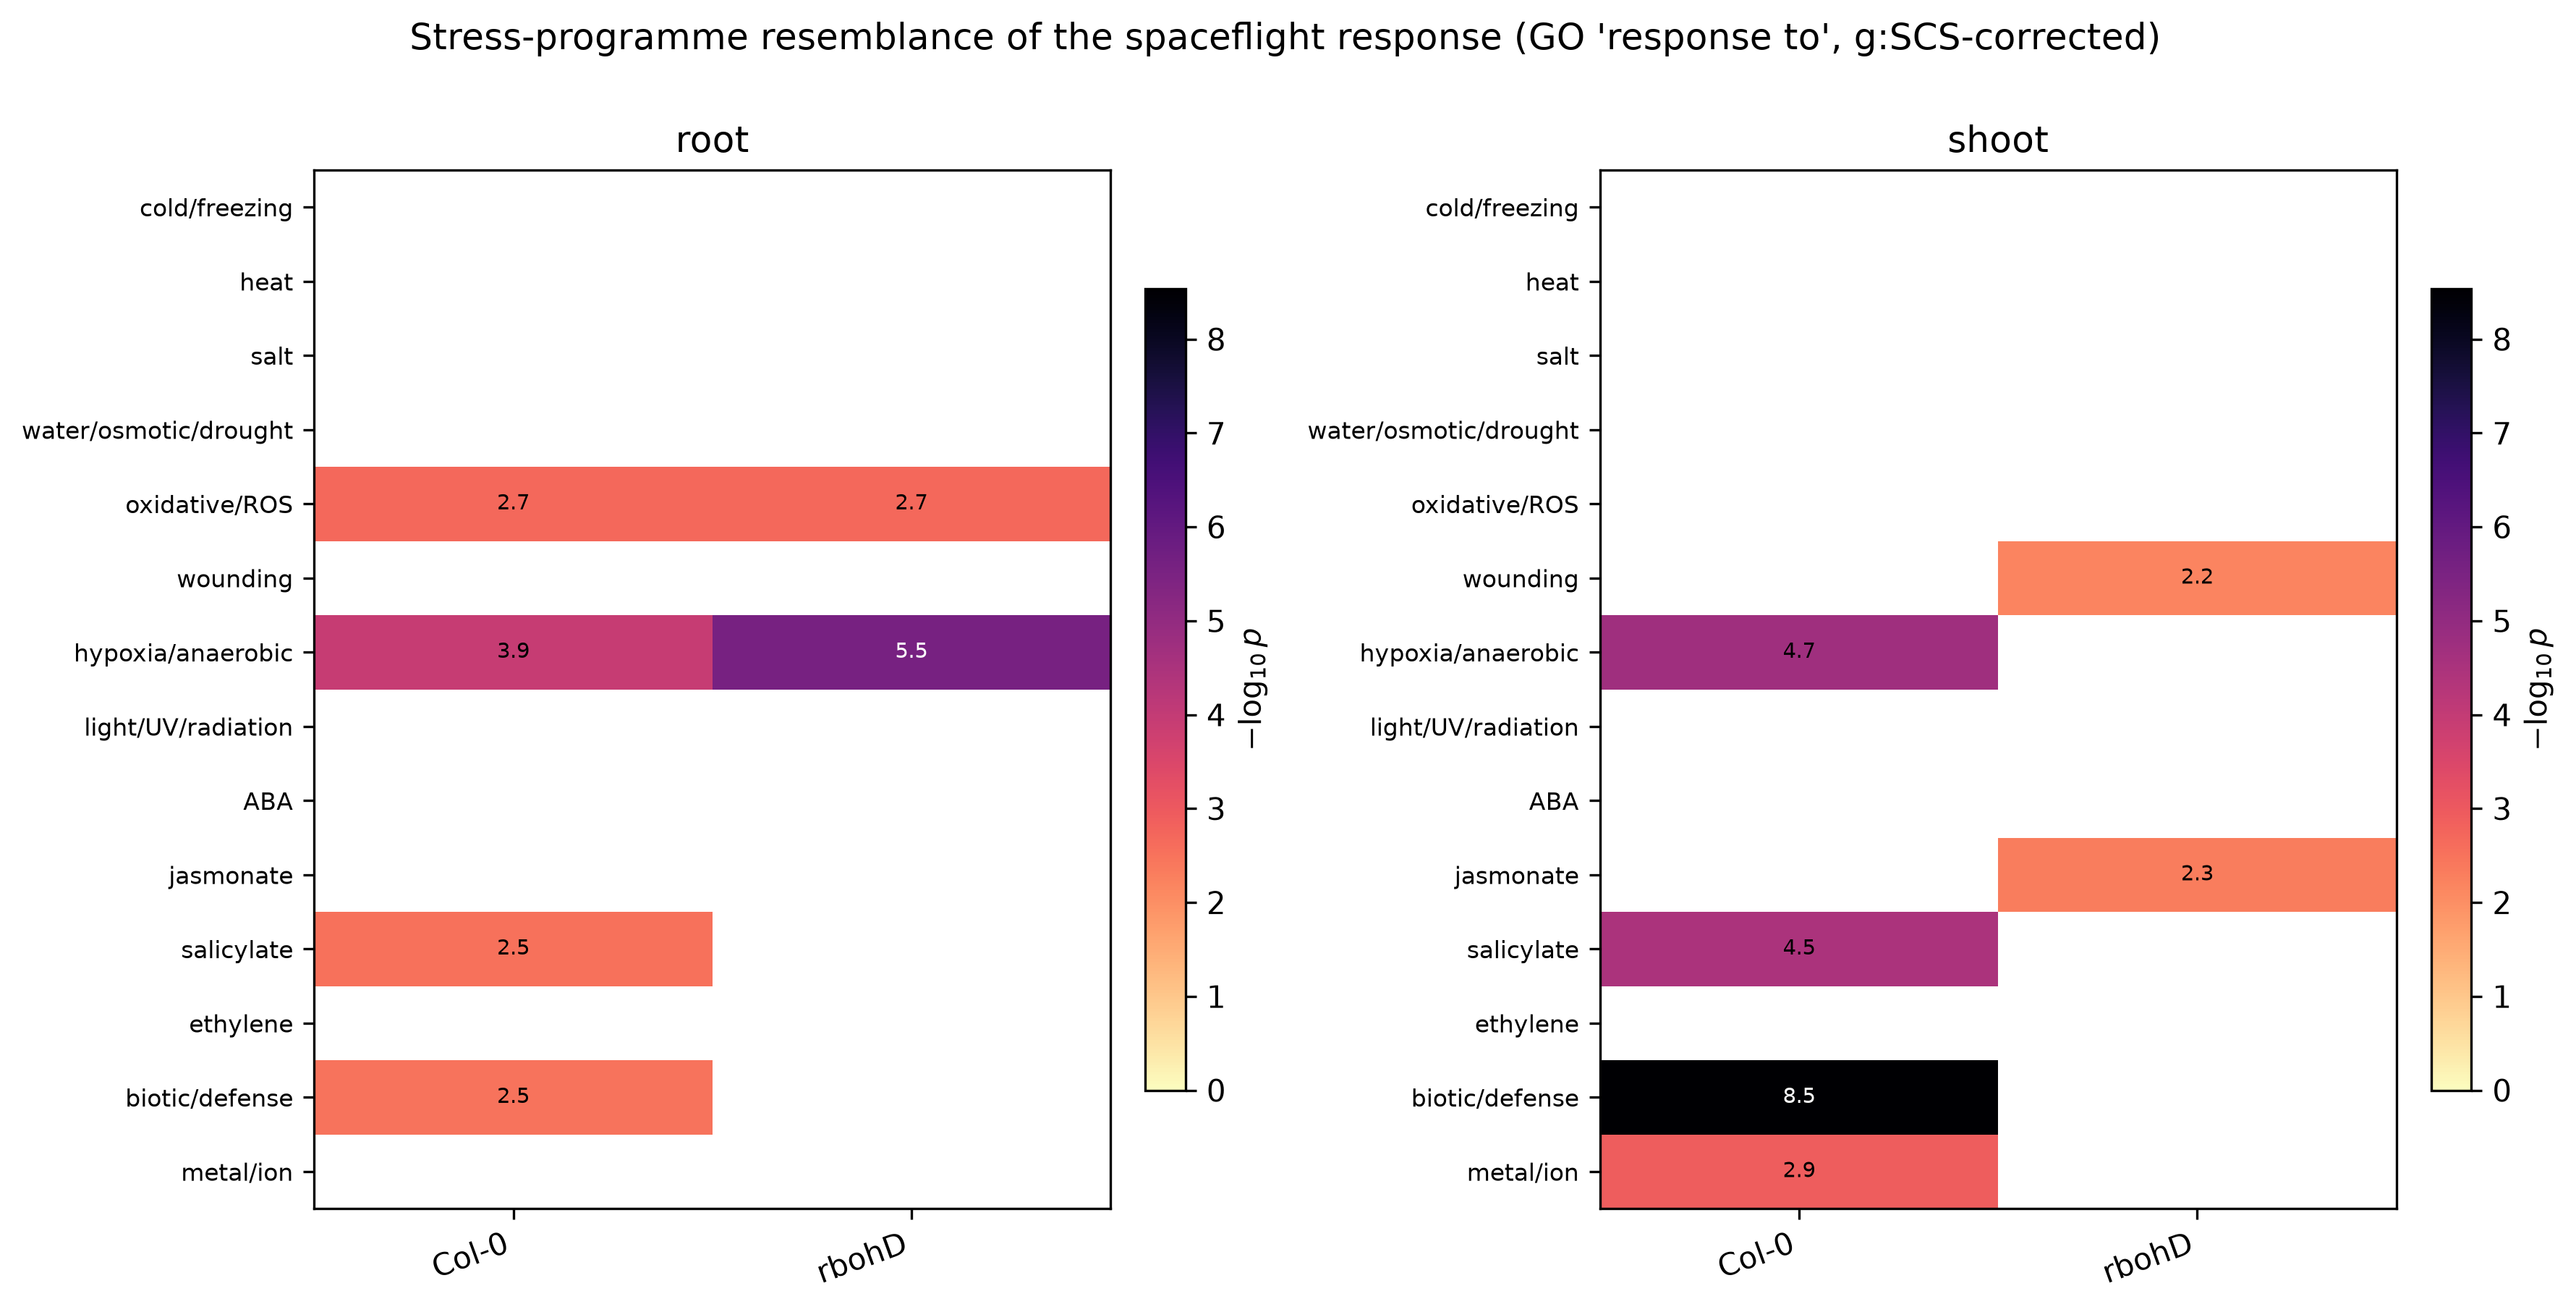
A stress-resemblance analysis (GO "response to" over-representation, computed per
organ; analysis/ml/apex05_physiospace_stress.py, Fig. 7) found the wild-type and
rbohD flight DEGs most resembled hypoxia, oxidative/ROS and defence
(salicylate/jasmonate/wounding) stress programmes — all documented features of
plant spaceflight — while cax2-2 matched none. The resemblance was
organ-specific: the root response decoded predominantly to hypoxia and
oxidative/ROS, whereas the shoot response decoded to defence/immune
programmes (biotic, salicylate in Col-0; jasmonate and wounding in rbohD). A
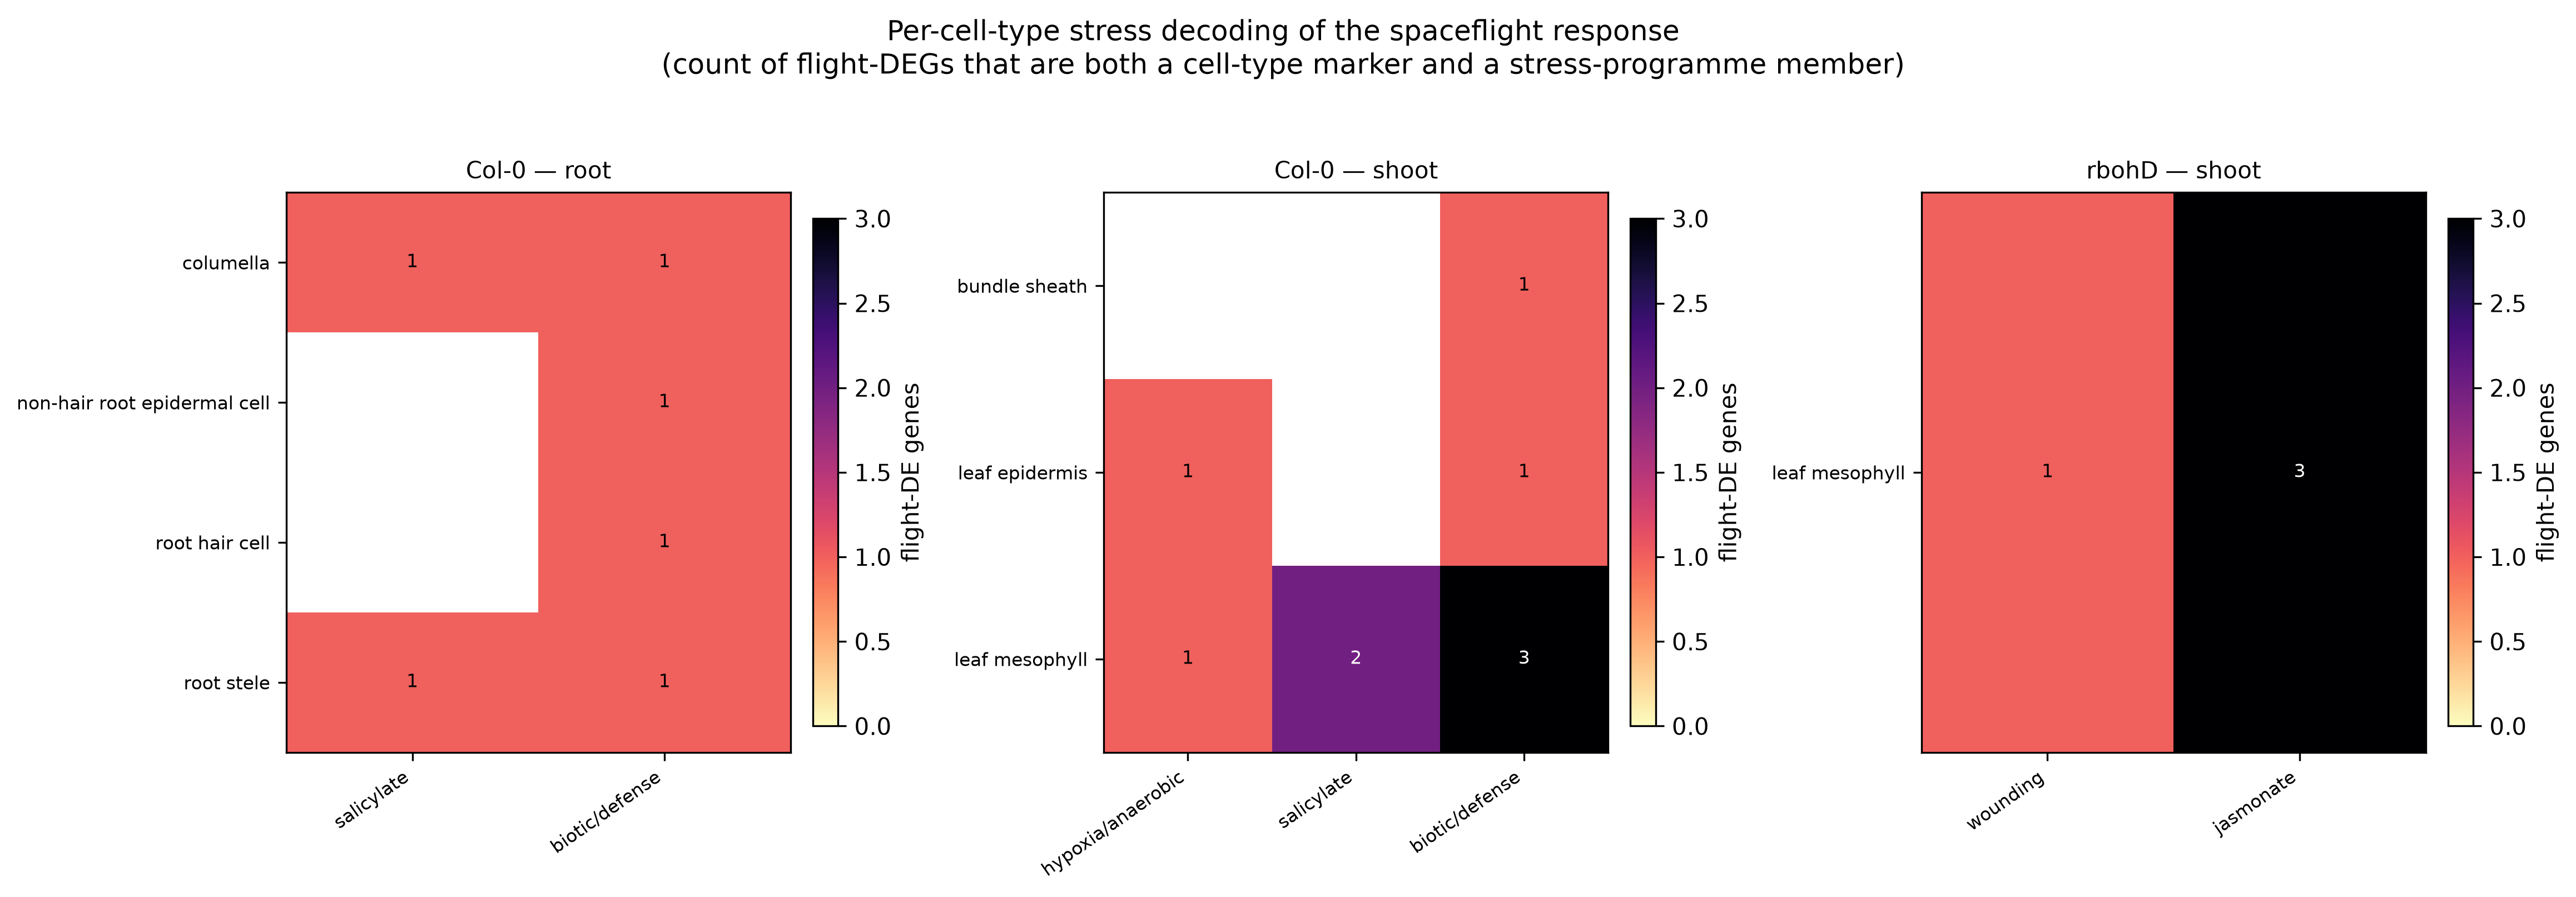
cell-type-resolved decoding (attributing the members of each significant stress
programme to cell types via the PCMDB markers; Fig. S3) localised the
defence/hormone signature chiefly to the leaf mesophyll (Col-0 → salicylate /
defence; rbohD → jasmonate), with scattered defence/salicylate genes in root
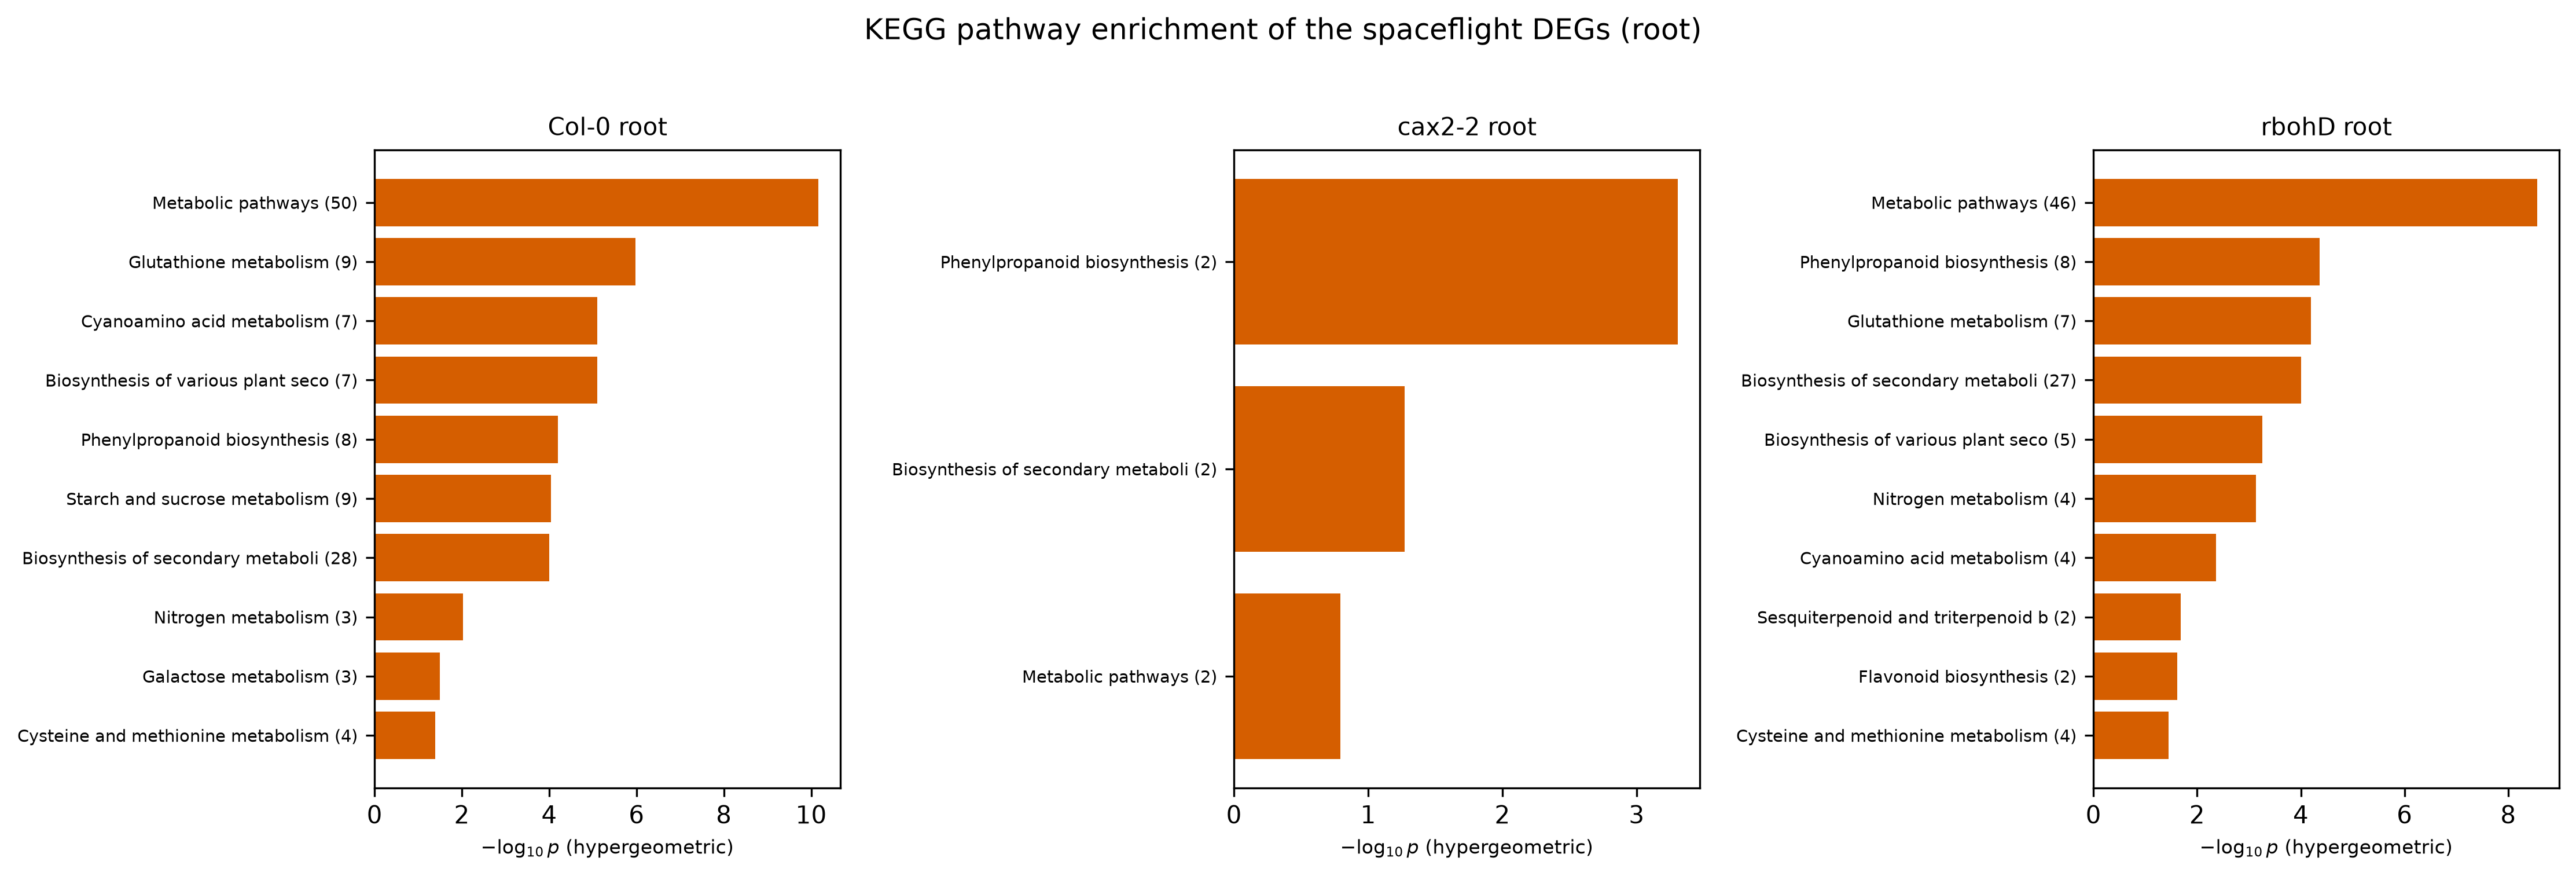
columella, epidermis and stele. Systems-level KEGG analysis
(analysis/ml/apex05_kegg_systems.py; ggKEGG maps in
analysis/R/apex05_ggkegg_pathways.R, Fig. 8) showed Col-0 and rbohD root
responses converging on glutathione metabolism and phenylpropanoid
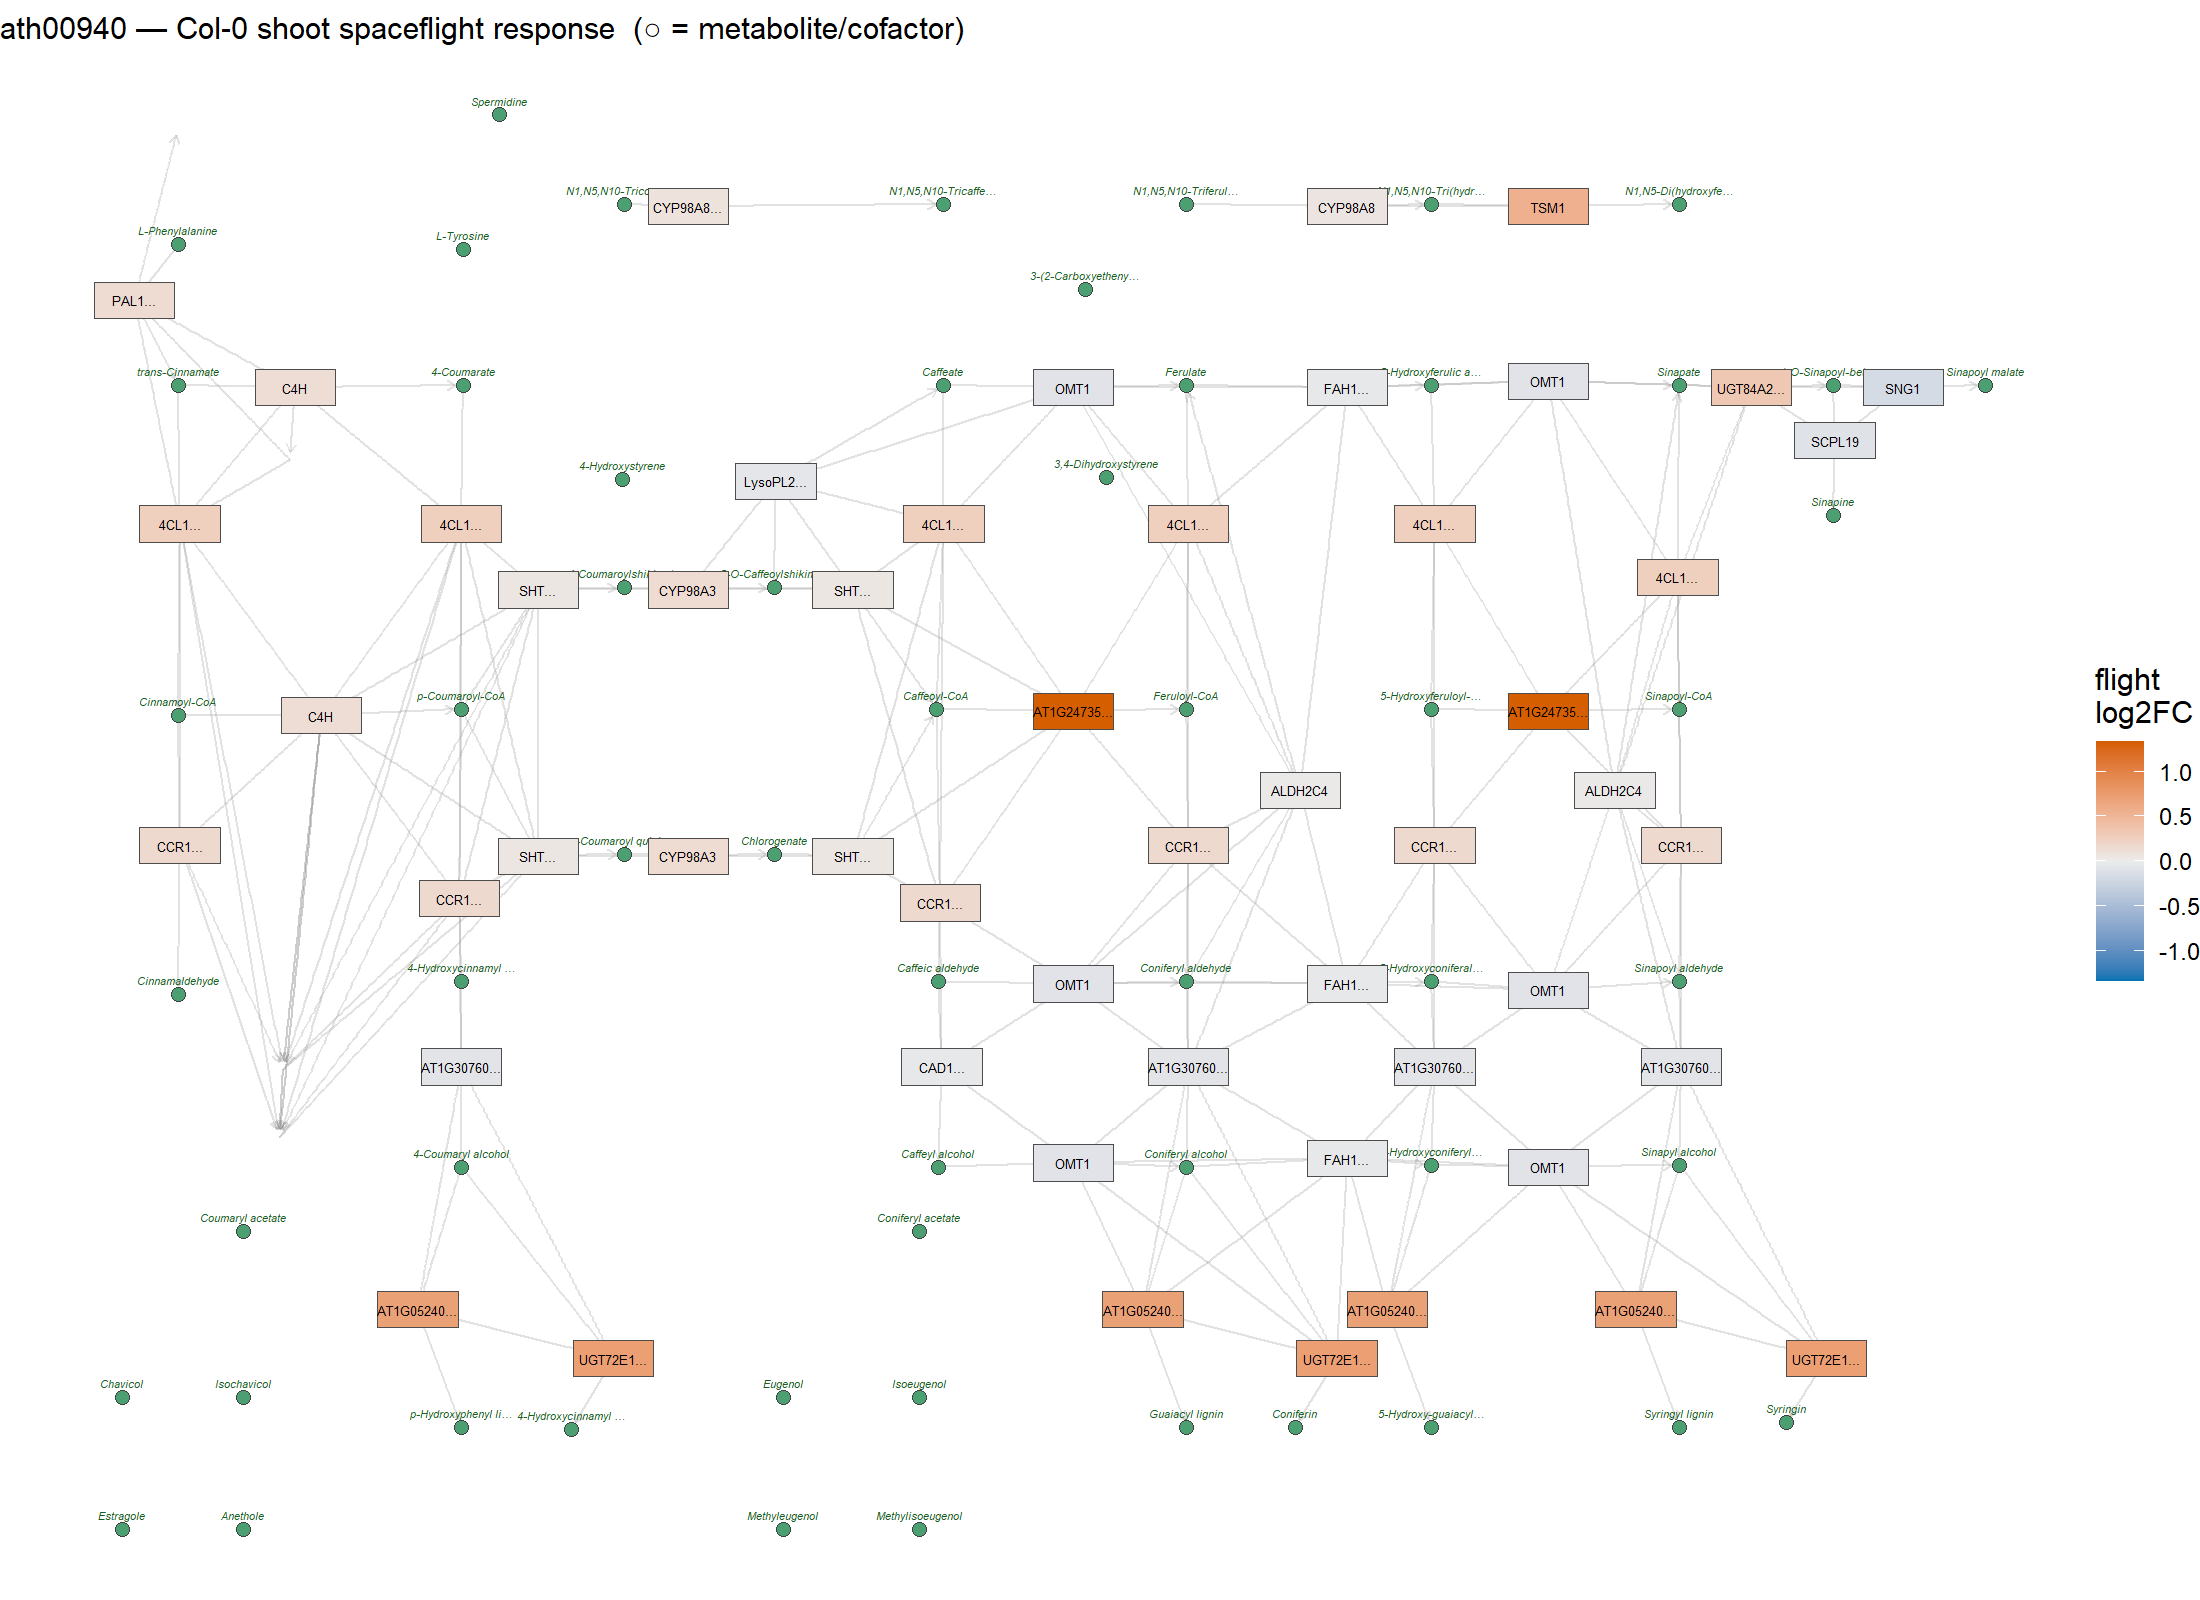
biosynthesis (plus broad secondary-metabolite pathways); the phenylpropanoid /
lignin pathway was broadly flight-induced in the Col-0 shoot (Fig. 8b). rbohD's
prominent glutathione-transferase and oxidoreductase signature is consistent with
its role in redox homeostasis.
6. Exploratory ligand–receptor analysis
Because cell–cell communication inference requires single-cell resolution (absent
here), we tested only whether canonical Arabidopsis peptide ligand–receptor
modules are flight-responsive in bulk (analysis/ml/apex05_ligand_receptor.py,
Fig. S2; explicitly exploratory). No module had both partners pass the DE
threshold; the peptide-signalling genes clustered near no-change, consistent with
their cell-type-restricted, lowly-expressed nature being diluted in bulk tissue.
Some defence-associated peptide ligands (PROPEP3, PIP2, IDA) were notably
flight-responsive in the rbohD shoot, fitting the defence-stress resemblance,
but true cell–cell communication mapping will require single-cell data.
Discussion
[Scaffold — expand.]
- CAX2 gates the transcriptional flight response. The near-complete loss of flight-induced differential expression in cax2-2, against a robust wild-type and rbohD response, places vacuolar Ca²⁺/H⁺ exchange upstream of the transcriptional spaceflight programme — consistent with calcium signalling as an early relay of the microgravity signal. [TO CONFIRM: mechanistic interpretation / citations.]
- Transcription–morphology uncoupling. That cax2-2 roots still shorten under flight despite a silent transcriptome implies a substantial transcription- independent (or pre-existing / post-transcriptional) component to the root-growth response, and cautions against reading morphological phenotypes directly from DEG counts.
- Cell-type context. Localisation to epidermis, cortex and columella points to gravity-sensing and environmental-interface tissues as the locus of the response. [TO CONFIRM.]
- Limitations. Bulk RNA-seq; cell-type resolution is marker-projection, not single-cell; the ligand–receptor analysis is exploratory; morphometrics are day-4 primary roots. [TO CONFIRM: leaf-area phenotype, growth hardware.]
Methods
- Plant material & spaceflight. Col-0, cax2-2 and rbohD [TO CONFIRM: allele/line identifiers, seed source]; ISS spaceflight vs ground control [TO CONFIRM: hardware, media, light, temperature, flight profile, fixation].
- Design & metadata. 4 genotypes × 4 wells × 2 tissues × 2 conditions
(64 libraries). The rep→well mapping and the RNA-seq↔RSML bridge are resolved
from the ALSDA sequencing S-numbers (
analysis/ml/apex05_data.py;data/metadata/). - RNA-seq & differential expression. Reads aligned with HISAT [TO CONFIRM:
versions/genome]; gene counts in
data/expression/counts_raw/apex05_gene_counts_all-genotypes_v2.2.csv. Differential expression with DESeq2 (pydeseq2), contrast FL vs GC per genotype × tissue, flight-referenced; DEGs at FDR < 0.05 and |log₂FC| > 1 (analysis/ml/apex05_deseq2_flight.py). All directions re-derived from the labelled FL/GC columns (the archived edgeR workbooks are GC-referenced). - LASSO. L1-penalised logistic regression on log2-CPM, most-parsimonious penalty by leave-one-out CV, stability-selected signature (≥75% of LOO refits); DEG overlap by hypergeometric test.
- Cell-type projection. PCMDB (Zenodo 10.5281/zenodo.5101271) cell-type- specific markers; hypergeometric DEG enrichment + per-sample signature scoring; ggPlantmap anatomy.
- Morphometrics & integration. RSML day-4 primary-root traits
(
data/morphometrics/); FL-vs-GC effect sizes (Cohen's d, Mann–Whitney); well-level join to the transcriptome. - Stress resemblance & pathways. g:Profiler GO "response to" axes computed per organ and (via PCMDB markers) per cell type; KEGG pathway membership (KEGG REST) and ggkegg maps; Plant Reactome queried (sparse for Arabidopsis, retained for transparency).
- Reproducibility. Python + R pipeline in
analysis/; dependencies inanalysis/ml/requirements.txt; single random seed; outputs inresults/.
Data & code availability
- Data & code: https://github.com/dr-richard-barker/APEX05_results_and_code (FAIR; MIT-licensed). Canonical counts, metadata, morphometrics, gene sets, analysis scripts, and all result tables/figures are included.
- Reference resources: PCMDB (Zenodo 10.5281/zenodo.5101271); KEGG; g:Profiler; Plant Reactome (Gramene).
- Sequencing archive: [TO CONFIRM: NASA OSDR / GeneLab accession(s)].
- Zenodo release/DOI: [TO CONFIRM: mint on submission].
Acknowledgements / Author contributions / Competing interests / Funding
[TO CONFIRM]
References
[TO CONFIRM]
Figure legends
See manuscript/figure_legends.md for the ML QC / CAX2-allele figures (Figs S,
from the FAIR-QC layer). Final-manuscript figures:
Figure 1 | Corrected 64-sample design and QC. Global PCA of log2-CPM (top
2,000 variable genes); PC1 (94%) separates root from shoot with no outliers, and
within-tissue FL vs GC separation is strong in Col-0/rbohD and weak in cax2-2.
Source: results/ml/figG1_qc_pca.png, qc_summary.json.
Figure 2 | Spaceflight differential expression across genotypes. DESeq2 DEG
counts (induced/repressed) per genotype × tissue on the corrected matrix; Col-0
and rbohD respond strongly, cax2-2 almost not at all.
Source: results/tables/deseq2/apex05_deseq2_DEG_counts.csv.
Figure 3 | LASSO corroborates the DESeq2 signal. Stability-selected sparse
flight signature per genotype × tissue; overlap with DESeq2 DEGs is strong for
Col-0/rbohD, minimal for cax2-2. Source: results/ml/figE1_lasso_flight_signature.png.
Figure 4 | Cell-type enrichment of the flight response (PCMDB projection).
Hypergeometric enrichment of flight DEGs in cell-type marker sets; Col-0/rbohD
root → epidermis, columella, cortex; rbohD shoot → mesophyll; cax2-2 flat.
Source: results/ml/figH1_celltype_deg_enrichment.png, figH2_*.
Figure 5 | Anatomical localisation (ggPlantmap). Root (and leaf) cross-section
painted by cell-type flight enrichment: outer-root (epidermis+cortex) in
Col-0/rbohD, blank in cax2-2. Source: results/ml/figM1_root_anatomy_flight.png,
figM2_leaf_anatomy_flight.png.
Figure 6 | Root-architecture flight response and multi-omics integration.
(a) Morphometric flight effects (Cohen's d, FL vs GC); roots shorten in all
genotypes. (b) Transcriptome vs phenotype magnitude (genotype level) — cax2-2's
transcriptome is disproportionately attenuated relative to its retained
root-shortening. (c) Per-well coupling (n = 12 root wells): per-well transcriptomic
flight magnitude vs |Δ root length| are uncorrelated (Spearman ρ = −0.30, p =
0.34); the transcriptomic axis separates cax2-2 (low) from Col-0/rbohD (high)
while root-shortening overlaps — the uncoupling at well resolution. Source:
results/ml/figI1_morphometric_flight_effects.png, figI2_*, figI3_welllevel_coupling.png;
per-gene linkage in results/tables/apex05_rnaseq_rsml_gene_correlation.csv.
Figure 7 | Stress-programme resemblance (per organ). GO "response to"
over-representation grouped into stress axes, computed separately for root and
shoot (two panels): the root flight response resembles hypoxia and oxidative/ROS,
the shoot response resembles defence/salicylate/jasmonate/wounding; cax2-2
matches none. Source: results/ml/figL1_stress_resemblance.png,
apex05_stress_resemblance.csv.
Figure 8 | Systems biology. (a) KEGG pathway enrichment (glutathione,
phenylpropanoid, secondary metabolism). (b) ggKEGG pathway maps with enzyme nodes
coloured by flight log₂FC and metabolite/cofactor nodes (green circles, named —
e.g. NADPH, NADP⁺, glutathione/GSSG, ascorbate, SAM, coenzyme A) shown in
context: phenylpropanoid biosynthesis (Col-0 shoot), glutathione metabolism
(rbohD shoot), plant hormone signal transduction (Col-0 root). Source:
results/ml/figK1_kegg_pathway_enrichment.png,
figJ_ath00940_col0_shoot.png, figJ_ath00480_rbohd_shoot.png,
figJ_ath04075_col0_root.png.
Figure S1 | cax2-3 exclusion (corrected data). Source:
results/ml/figF1_cax2_concordance_fixed.png; docs/cax2_allele_concordance.md.
Figure S2 | Exploratory peptide ligand–receptor flight-responsiveness.
Source: results/ml/figN1_ligand_receptor.png.
Figure S3 | Cell-type-resolved stress decoding. For each significant stress
programme (Fig. 7), its member flight-DEGs are attributed to cell types via the
PCMDB markers; each cell reports the number of flight-DEGs that are both a
cell-type marker and a member of that stress programme (apex05_celltype_stress_decoding.py).
The defence/hormone signature localises chiefly to leaf mesophyll (Col-0 →
salicylate/defence; rbohD → jasmonate), with scattered root-cell-type
contributions. Exploratory: attribution is limited because cell-type-specific
markers rarely coincide with broadly-expressed stress genes. Source:
results/ml/figL2_celltype_stress_decoding.png,
results/tables/apex05_celltype_stress_decoding.csv.
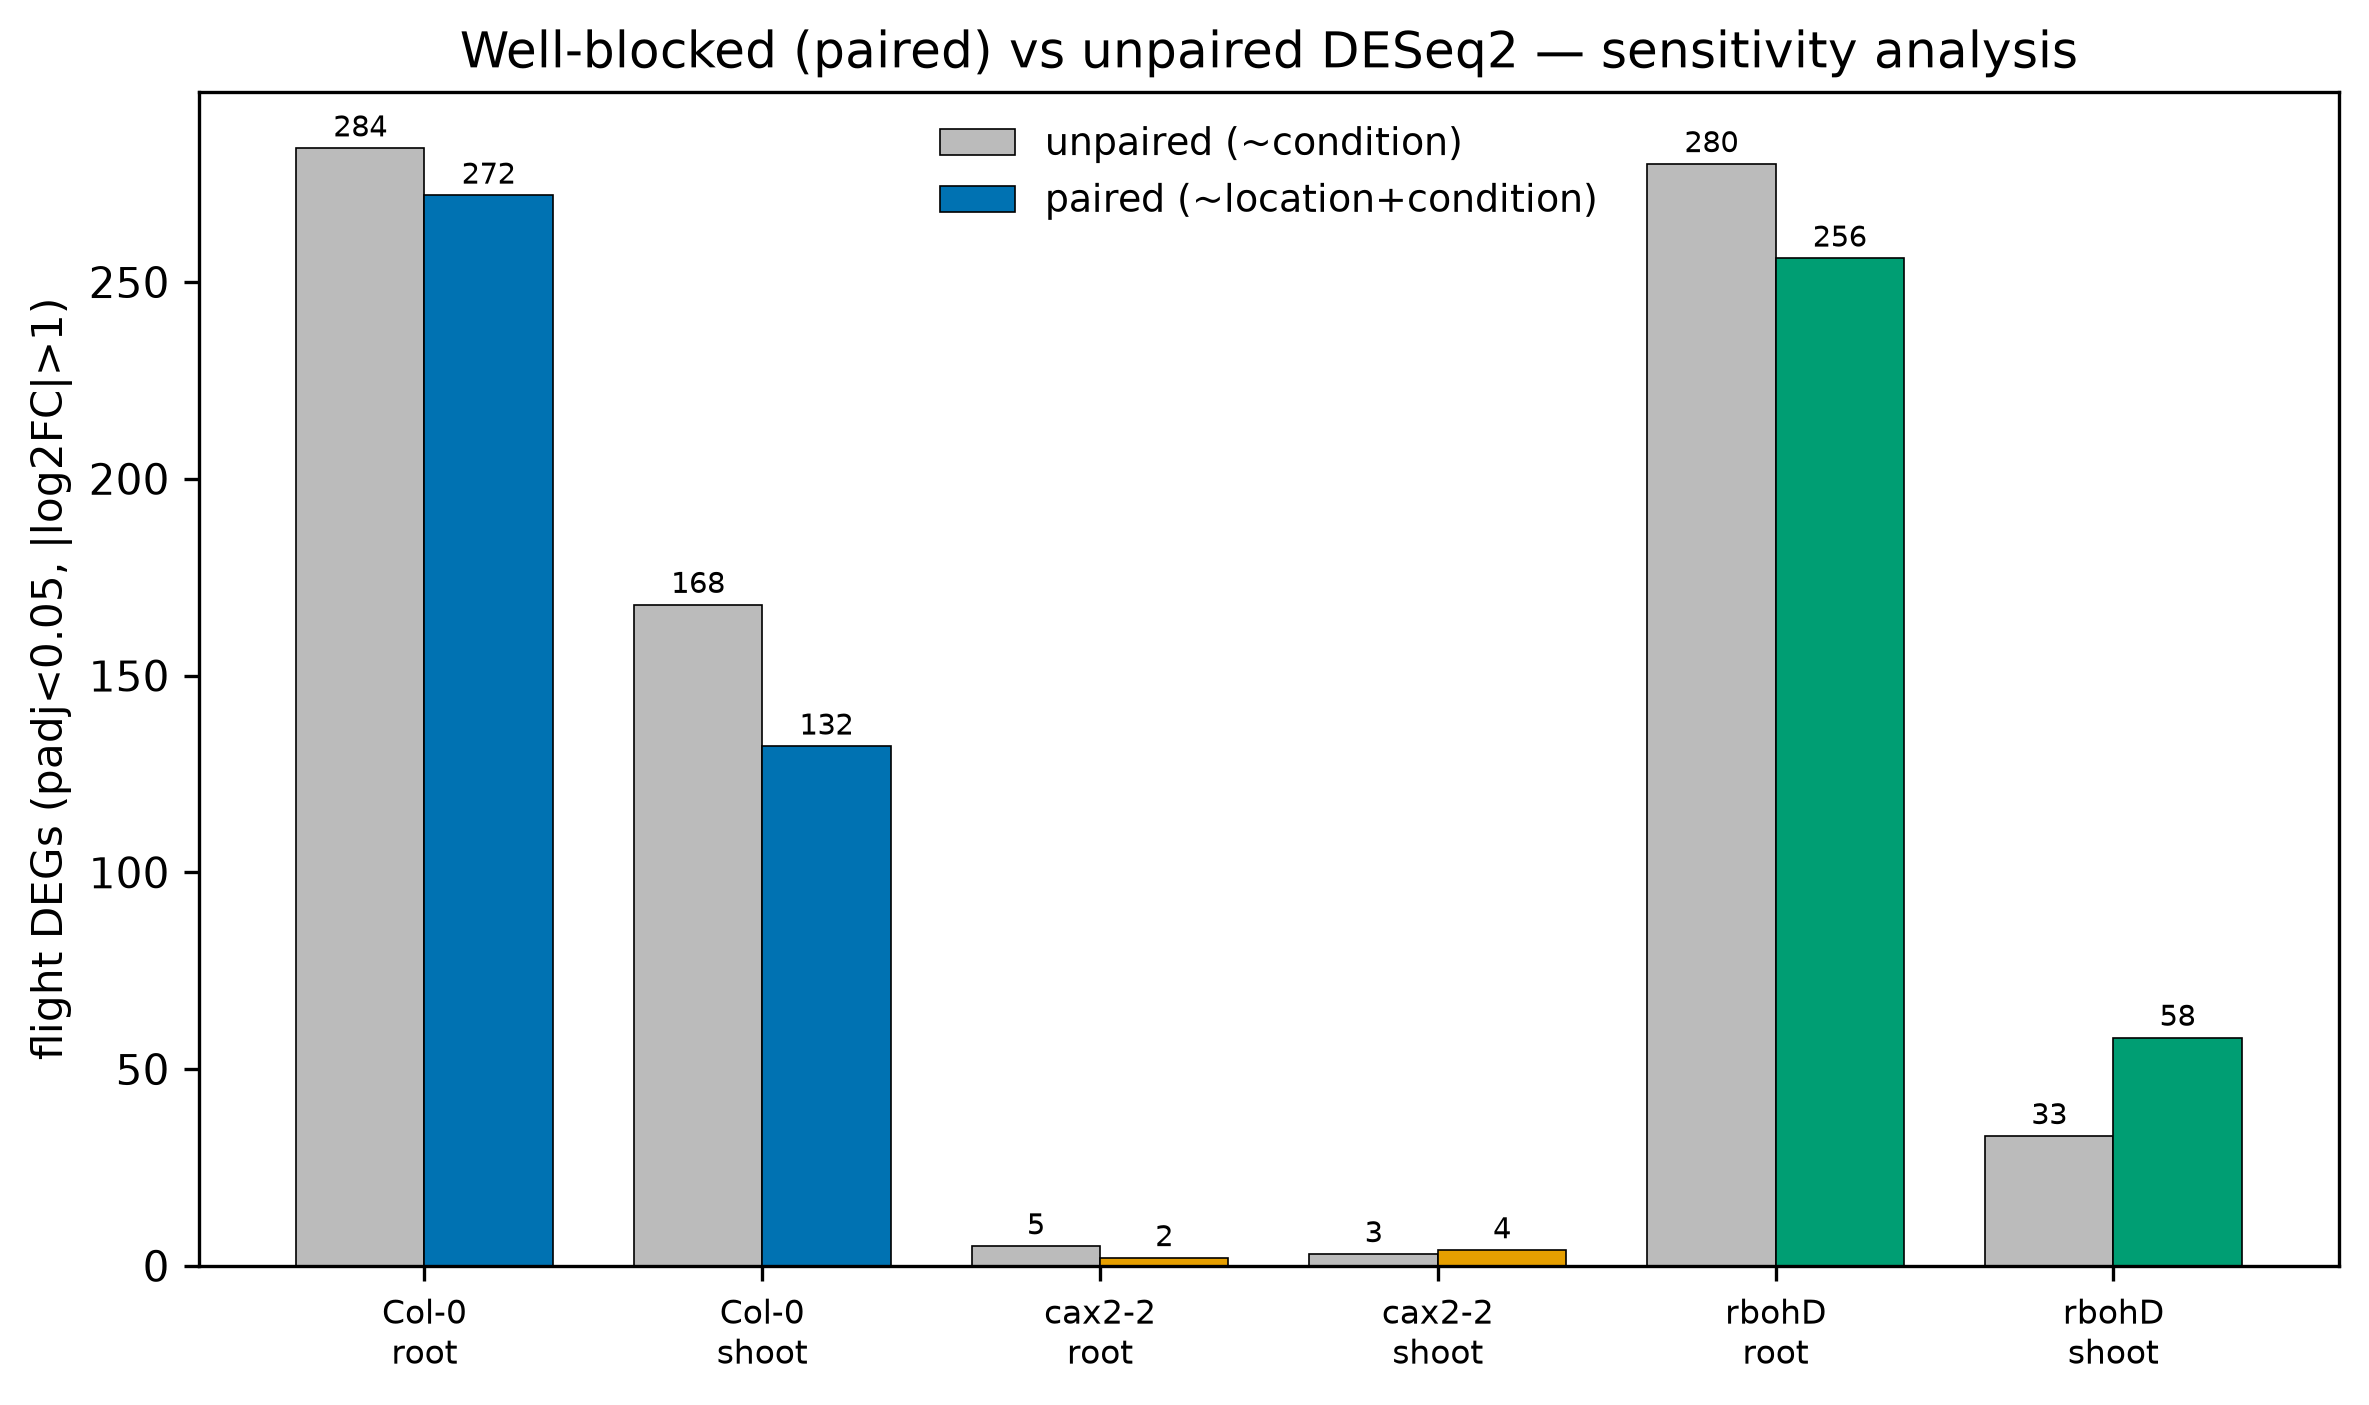
Figure S4 | Well-blocked (paired) DESeq2 — sensitivity analysis. Flight-DEG
counts from the primary unpaired model (~ condition) vs a paired model that
blocks on plate well (~ location + condition), exploiting the position-paired
design. Counts are broadly concordant (Col-0 root 284→272, rbohD root 280→256,
cax2-2 root 5→2; rbohD shoot gains power 33→58), and every qualitative
conclusion is unchanged — strong Col-0/rbohD responses, near-absent cax2-2 —
so the flight-DEG calls are robust to well blocking. Source: results/ml/figO1_paired_vs_unpaired_DEGs.png,
results/tables/apex05_deseq2_paired_vs_unpaired.csv;
analysis/ml/apex05_deseq2_paired.py.
Figure S5 | Flight-DEG overlap across genotypes. Three-way Venn of the DESeq2
flight-DEG sets (Col-0, cax2-2, rbohD) for root and shoot. Wild type and
rbohD share a 180-gene root flight core (of 284 / 280 DEGs); only 2 genes
are shared by all three; cax2-2 is near-empty. The shoot response is more
genotype-specific (Col-0 ∩ rbohD = 4). Source:
results/ml/figP1_deg_overlap_venn.png,
results/tables/apex05_deg_overlap_membership.csv;
analysis/ml/apex05_deg_overlap.py.