Lunar Crustal Magnetic Field Heterogeneity & Biological Implications
A FAIR-compliant planetary geophysics and space biology investigation evaluating hypomagnetic field (HMF) environments across active, historical, and candidate human landing sites on the Moon. Target journal: npj Microgravity (Nature Publishing Group).
📌 Executive Summary & Core Story
Unlike Earth, which maintains a continuous global dipole dynamo producing a ~50 µT (~50,000 nT) geomagnetic field, the Moon underwent core dynamo extinction over 3 billion years ago. Today, the lunar surface presents localized, non-dipolar crustal magnetic anomalies interspersed with vast near-null regions.
When biological payloads and human habitats land on the Moon—including all 13 Artemis III South Pole candidate regions—they operate under extreme hypomagnetic field (HMF) conditions (< 1.0 nT), over 30,000× weaker than Earth’s magnetic field. This study combines satellite magnetometer observations (Lunar Prospector & SELENE/Kaguya) with a systematic review of magnetobiology literature to quantify environmental risks for long-duration lunar biological payloads and bioregenerative life support systems.
📊 Manuscript Figures & Scientific Findings
Figure 1: Global Map of Lunar Crustal Magnetic Field Magnitude
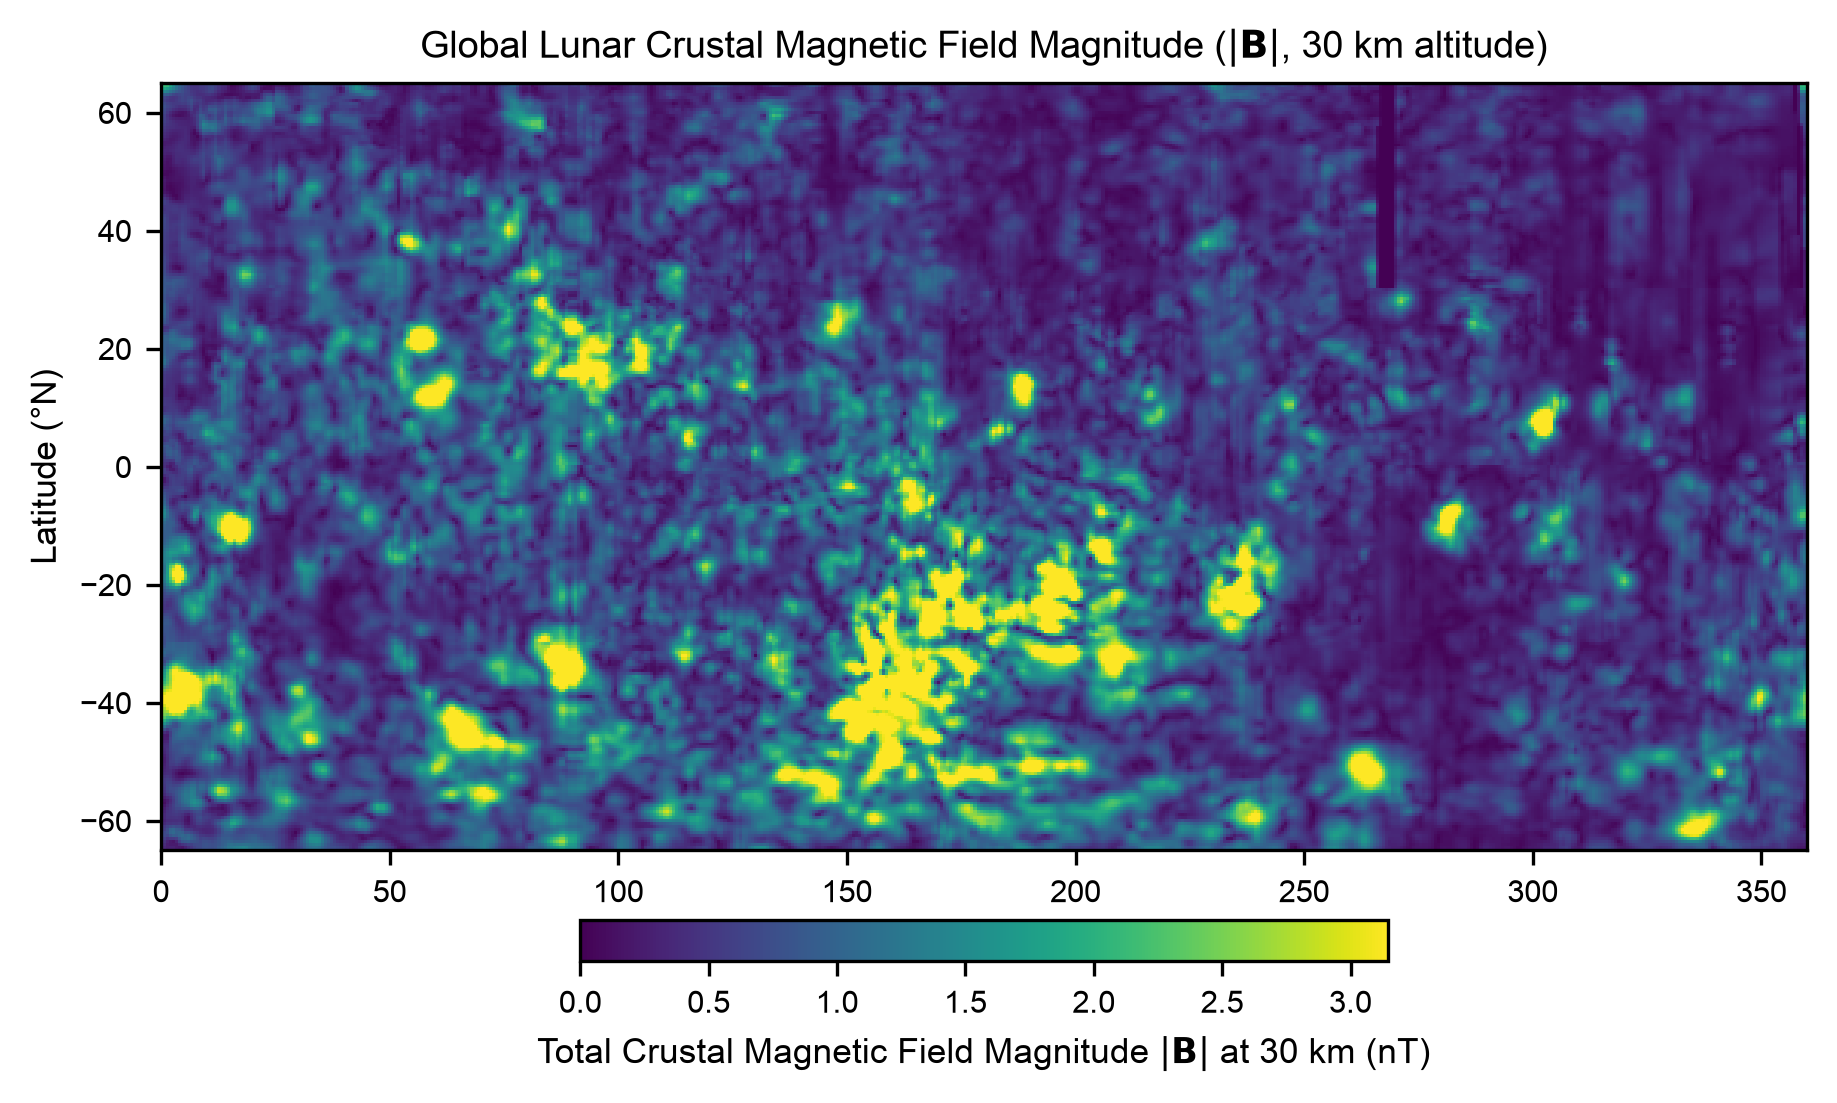
Figure 1 | Global distribution of lunar crustal magnetic field magnitude (|B|). Total field intensity |B| at 30 km altitude derived from Lunar Prospector and SELENE (Kaguya) magnetometer observations. Global background field is ultra-low (mean |B| = 0.77 nT, median = 0.56 nT), punctuated by intense localized crustal anomalies concentrated in the South Pole-Aitken (SPA) basin and impact basin antipodes.
Key Insights:
- Severe Global Depletion: Over 90% of the lunar surface experiences magnetic field magnitudes below 1.5 nT at 30 km altitude.
- Localized Anomalies: Strong crustal remanent magnetizations occur predominantly in the South Pole-Aitken (SPA) basin and antipodal to young impact basins (Crisium, Orientale, Serenitatis).
Figure 2: Constituent Vector Field Components (Br, Bθ, Bφ)
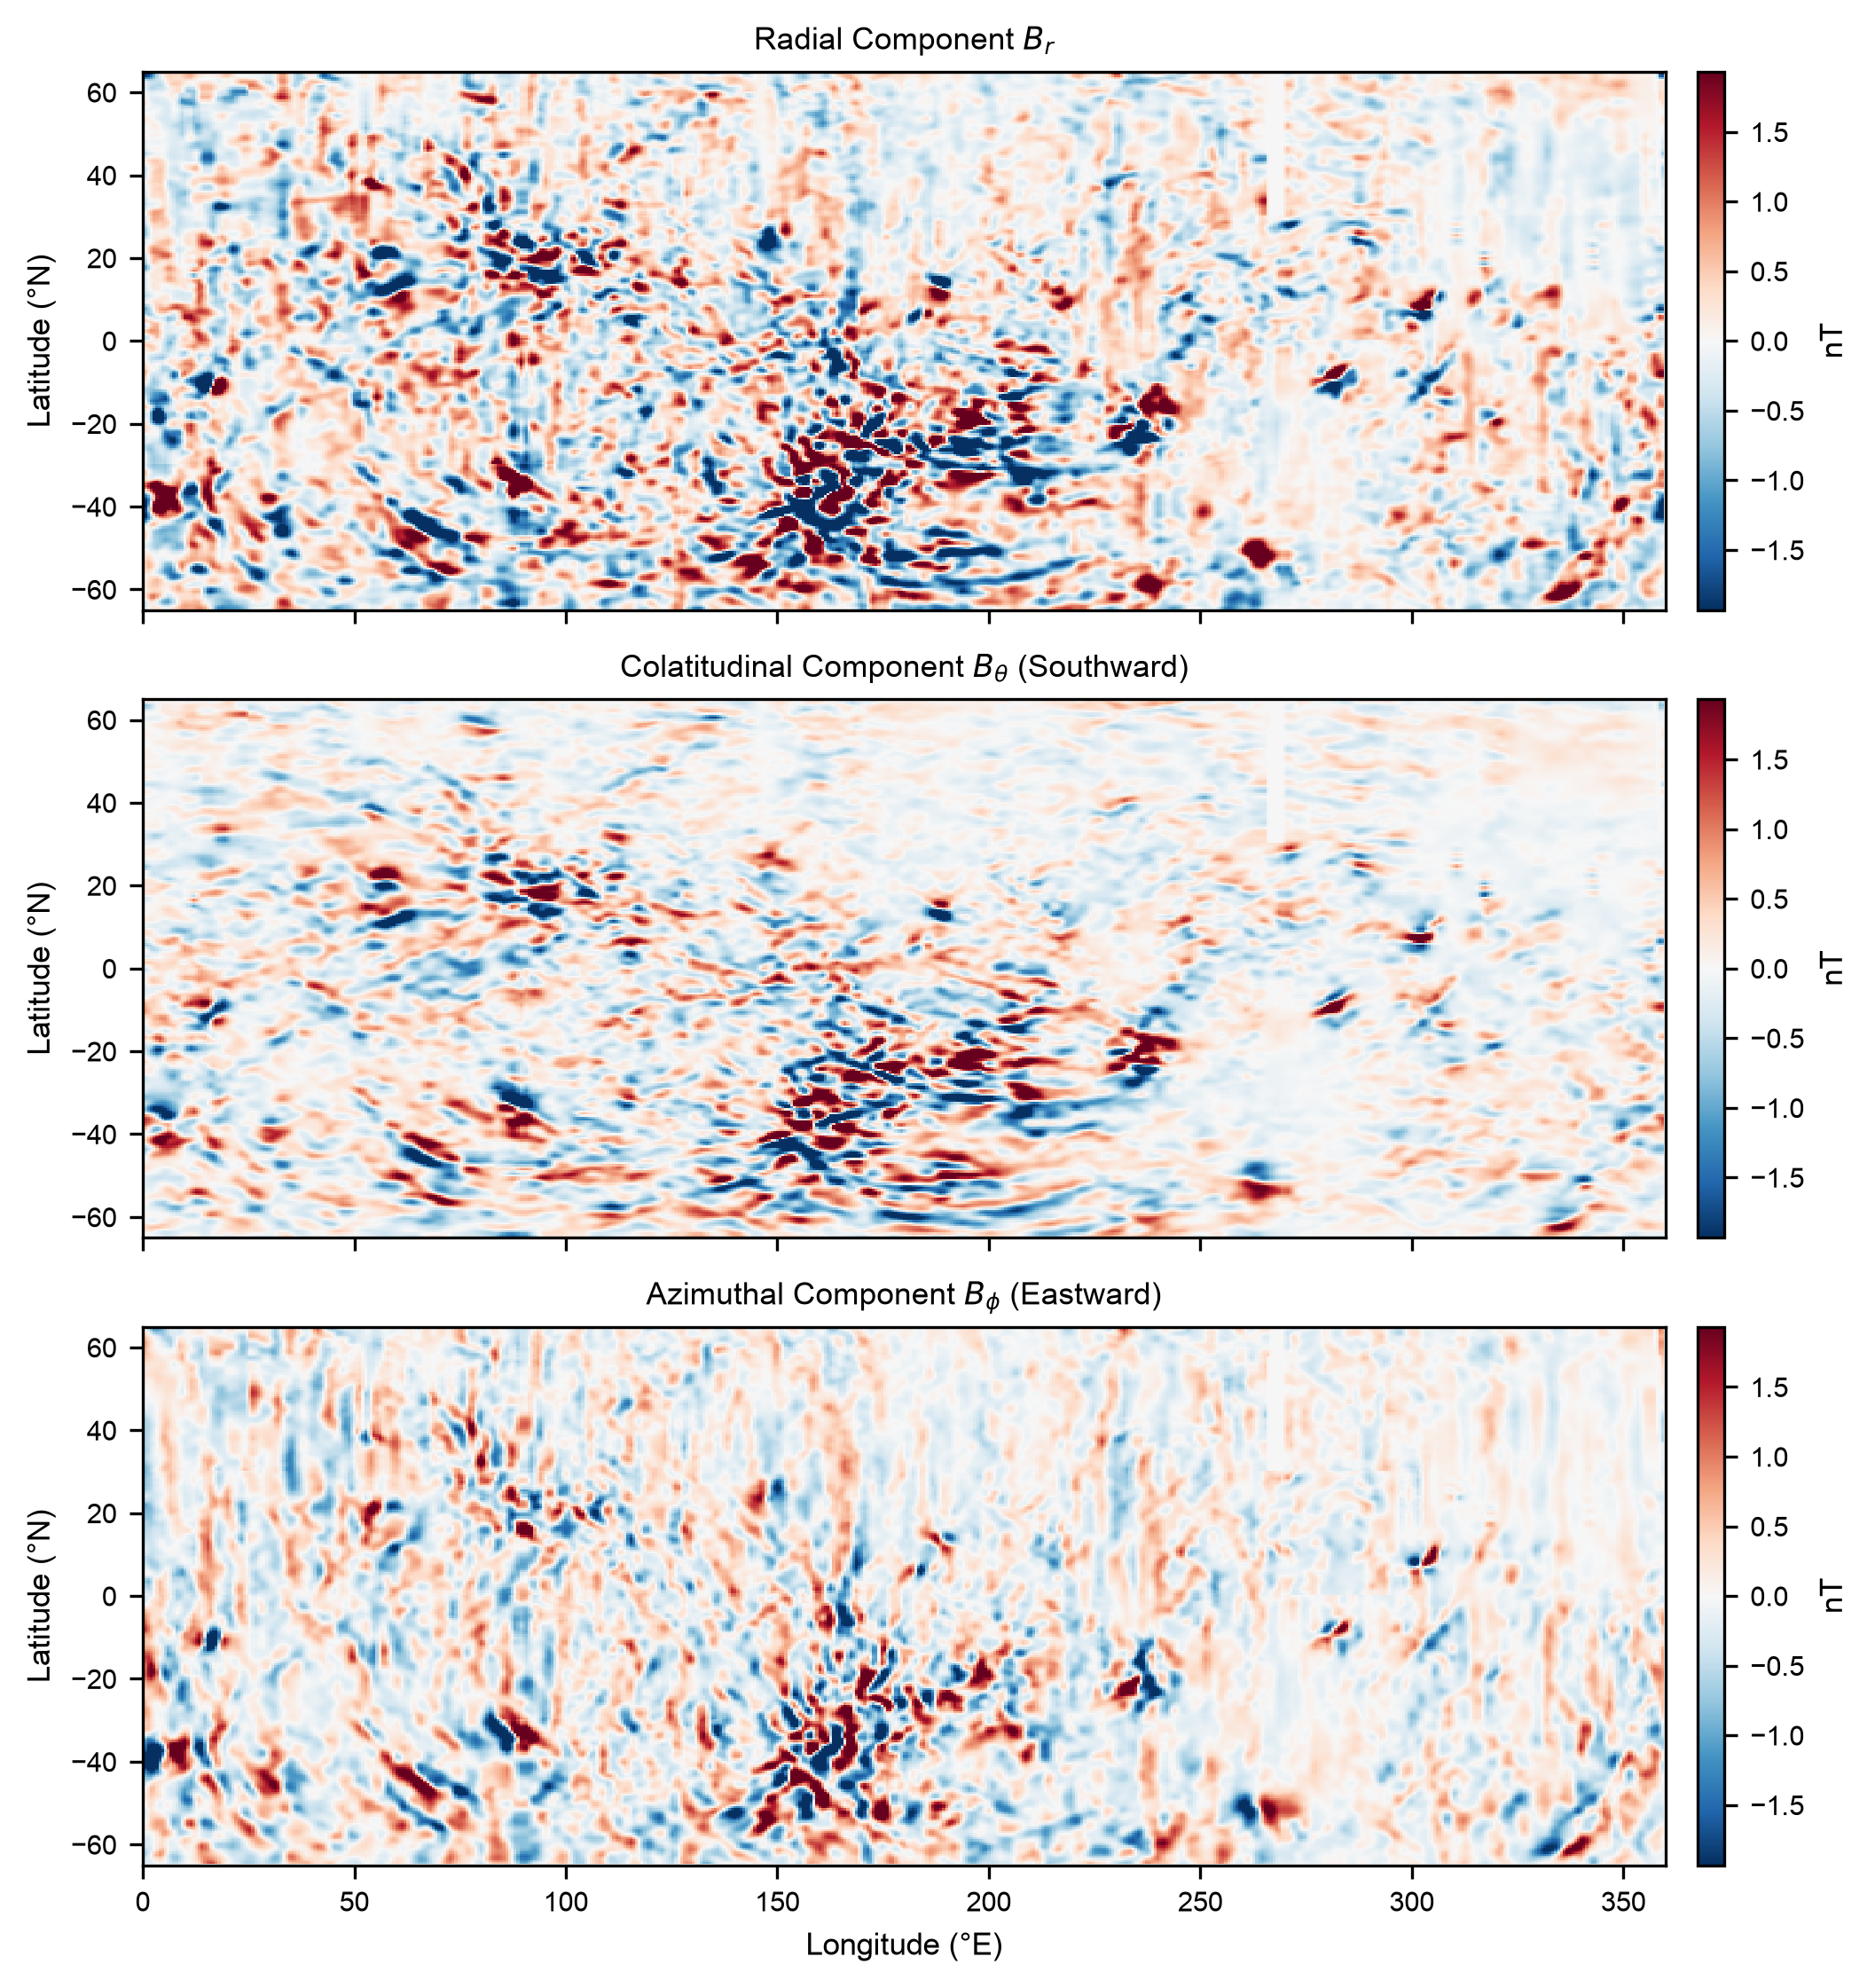
Figure 2 | Three-component vector decomposition of the lunar magnetic field at 30 km. Top: Radial component (Br). Middle: Colatitudinal/Southward component (Bθ). Bottom: Azimuthal/Eastward component (Bφ). Units in nanoteslas (nT).
Key Insights:
- Complex Multi-Polar Topology: Unlike Earth’s smooth dipolar field, lunar crustal fields display intricate multipolar vector directions, reflecting localized shock magnetization and intrusive magmatic bodies during early lunar history.
- Mini-Magnetospheres: At strong anomaly crests, vector inclinations generate local magnetic deflections capable of repelling solar wind ions, forming characteristic optical “lunar swirls” (e.g., Reiner Gamma).
Figure 3: Candidate & Historical Landing Sites Overlay
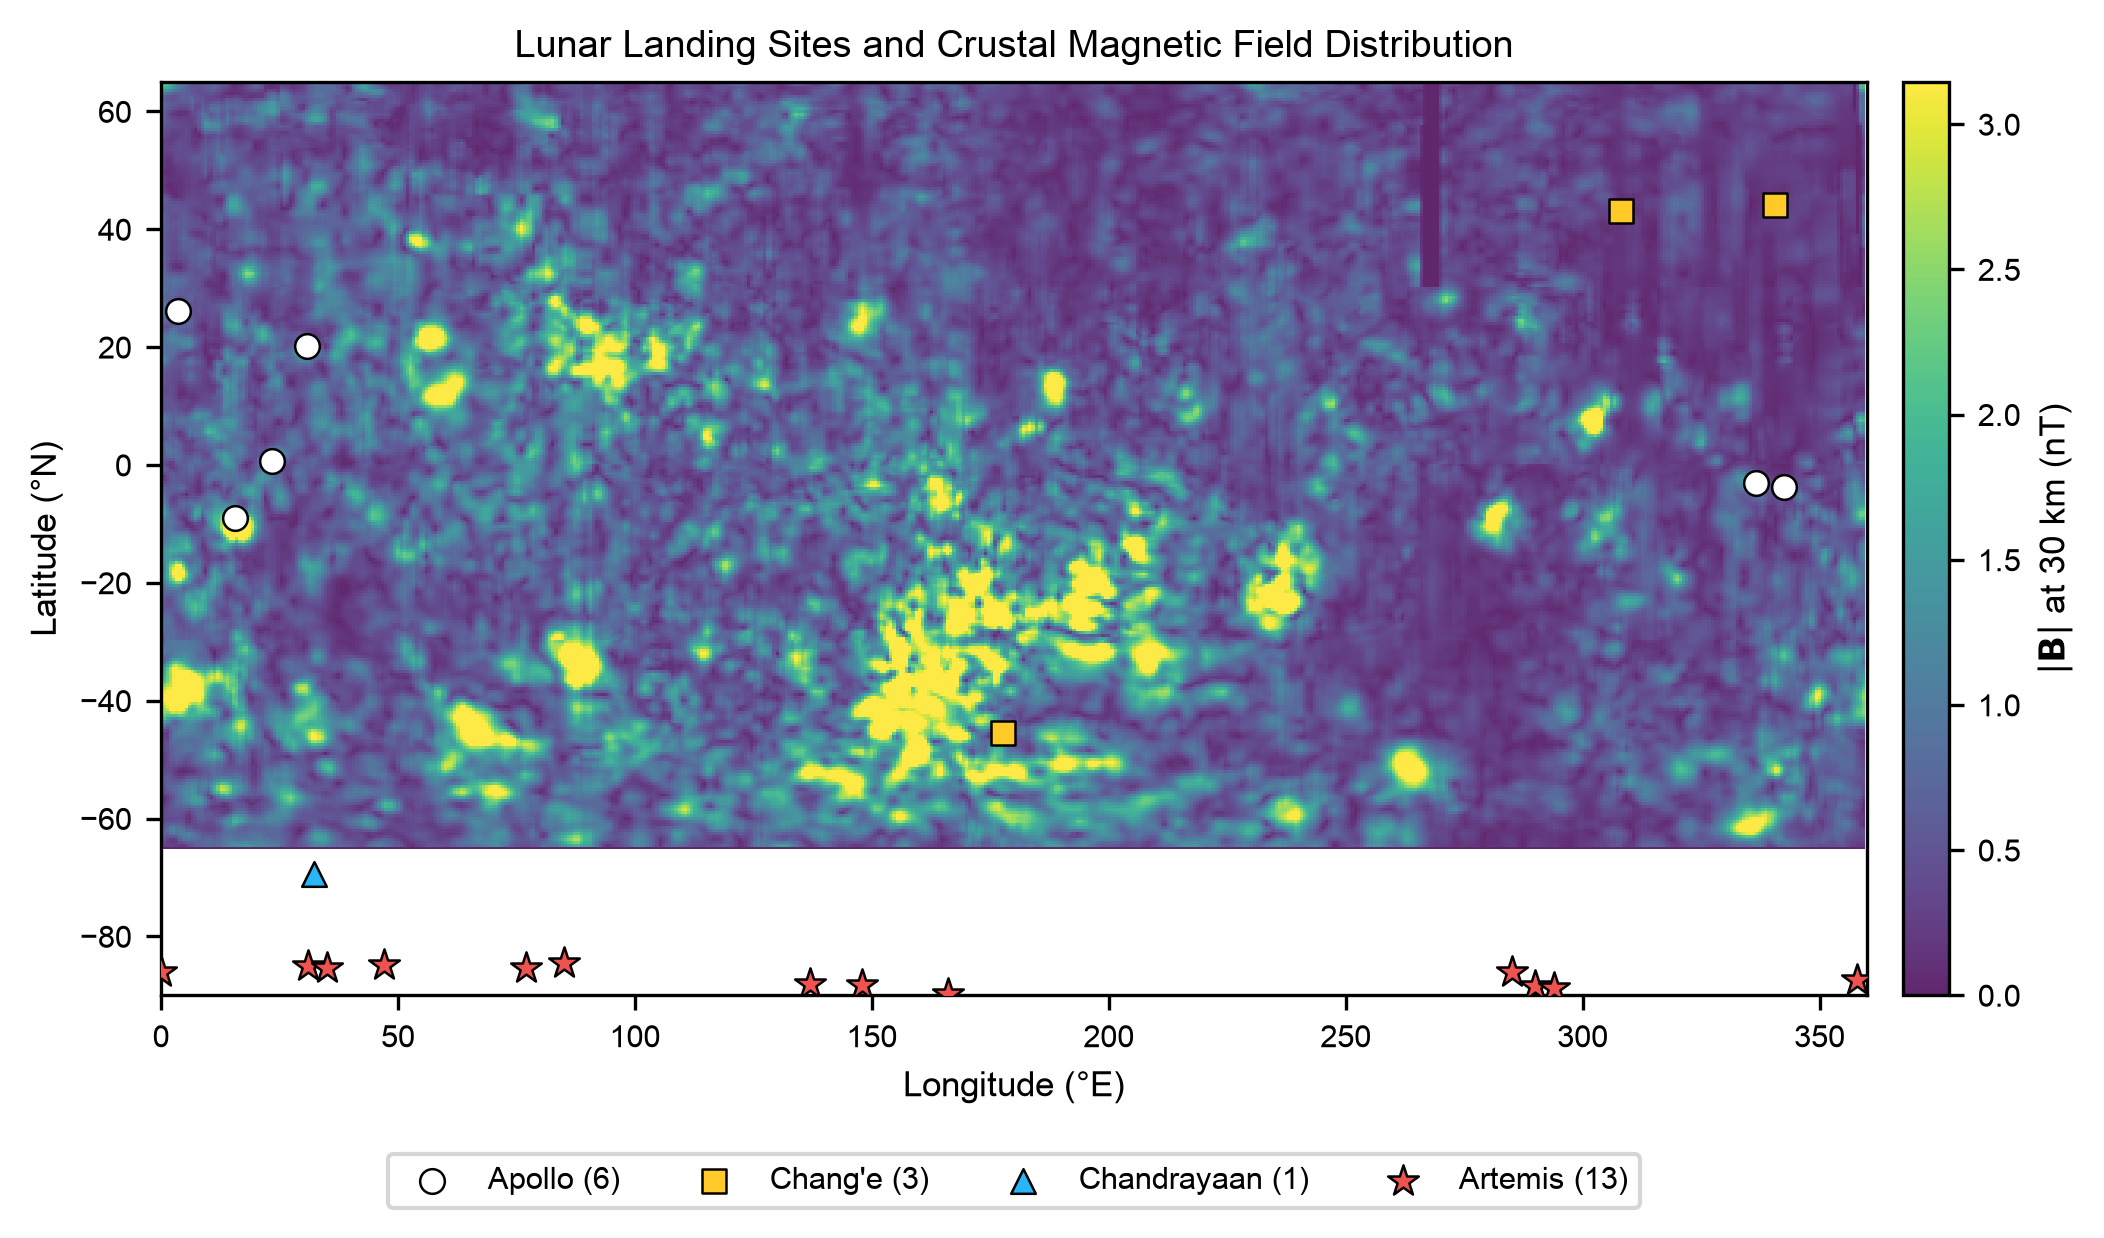
Figure 3 | Geographic overlay of 23 key lunar mission sites on the crustal magnetic field map. Yellow stars: 13 Artemis III South Polar candidate regions; Blue circles: Apollo 11–17 landing sites; Green squares: Chang'e 3, 4, & 5 sites; Red triangle: Chandrayaan-3.
Key Insights:
- Artemis III Polar Clustering: All 13 candidate Artemis III landing regions (Haworth, Malapert Massif, Shackleton, Peak Near Shackleton, etc.) lie between 84°S and 90°S in an ultra-low field corridor (< 1.0 nT).
- Equatorial vs Highland Contrast: Apollo 11, 12, 14, and 15 mare sites reside in low-field regions (< 1 nT), whereas Apollo 16 in the Descartes Highlands sits adjacent to a moderate field anomaly (~4.95 nT at 30 km).
Figure 4: Comparative Field Strengths Across Landing Sites
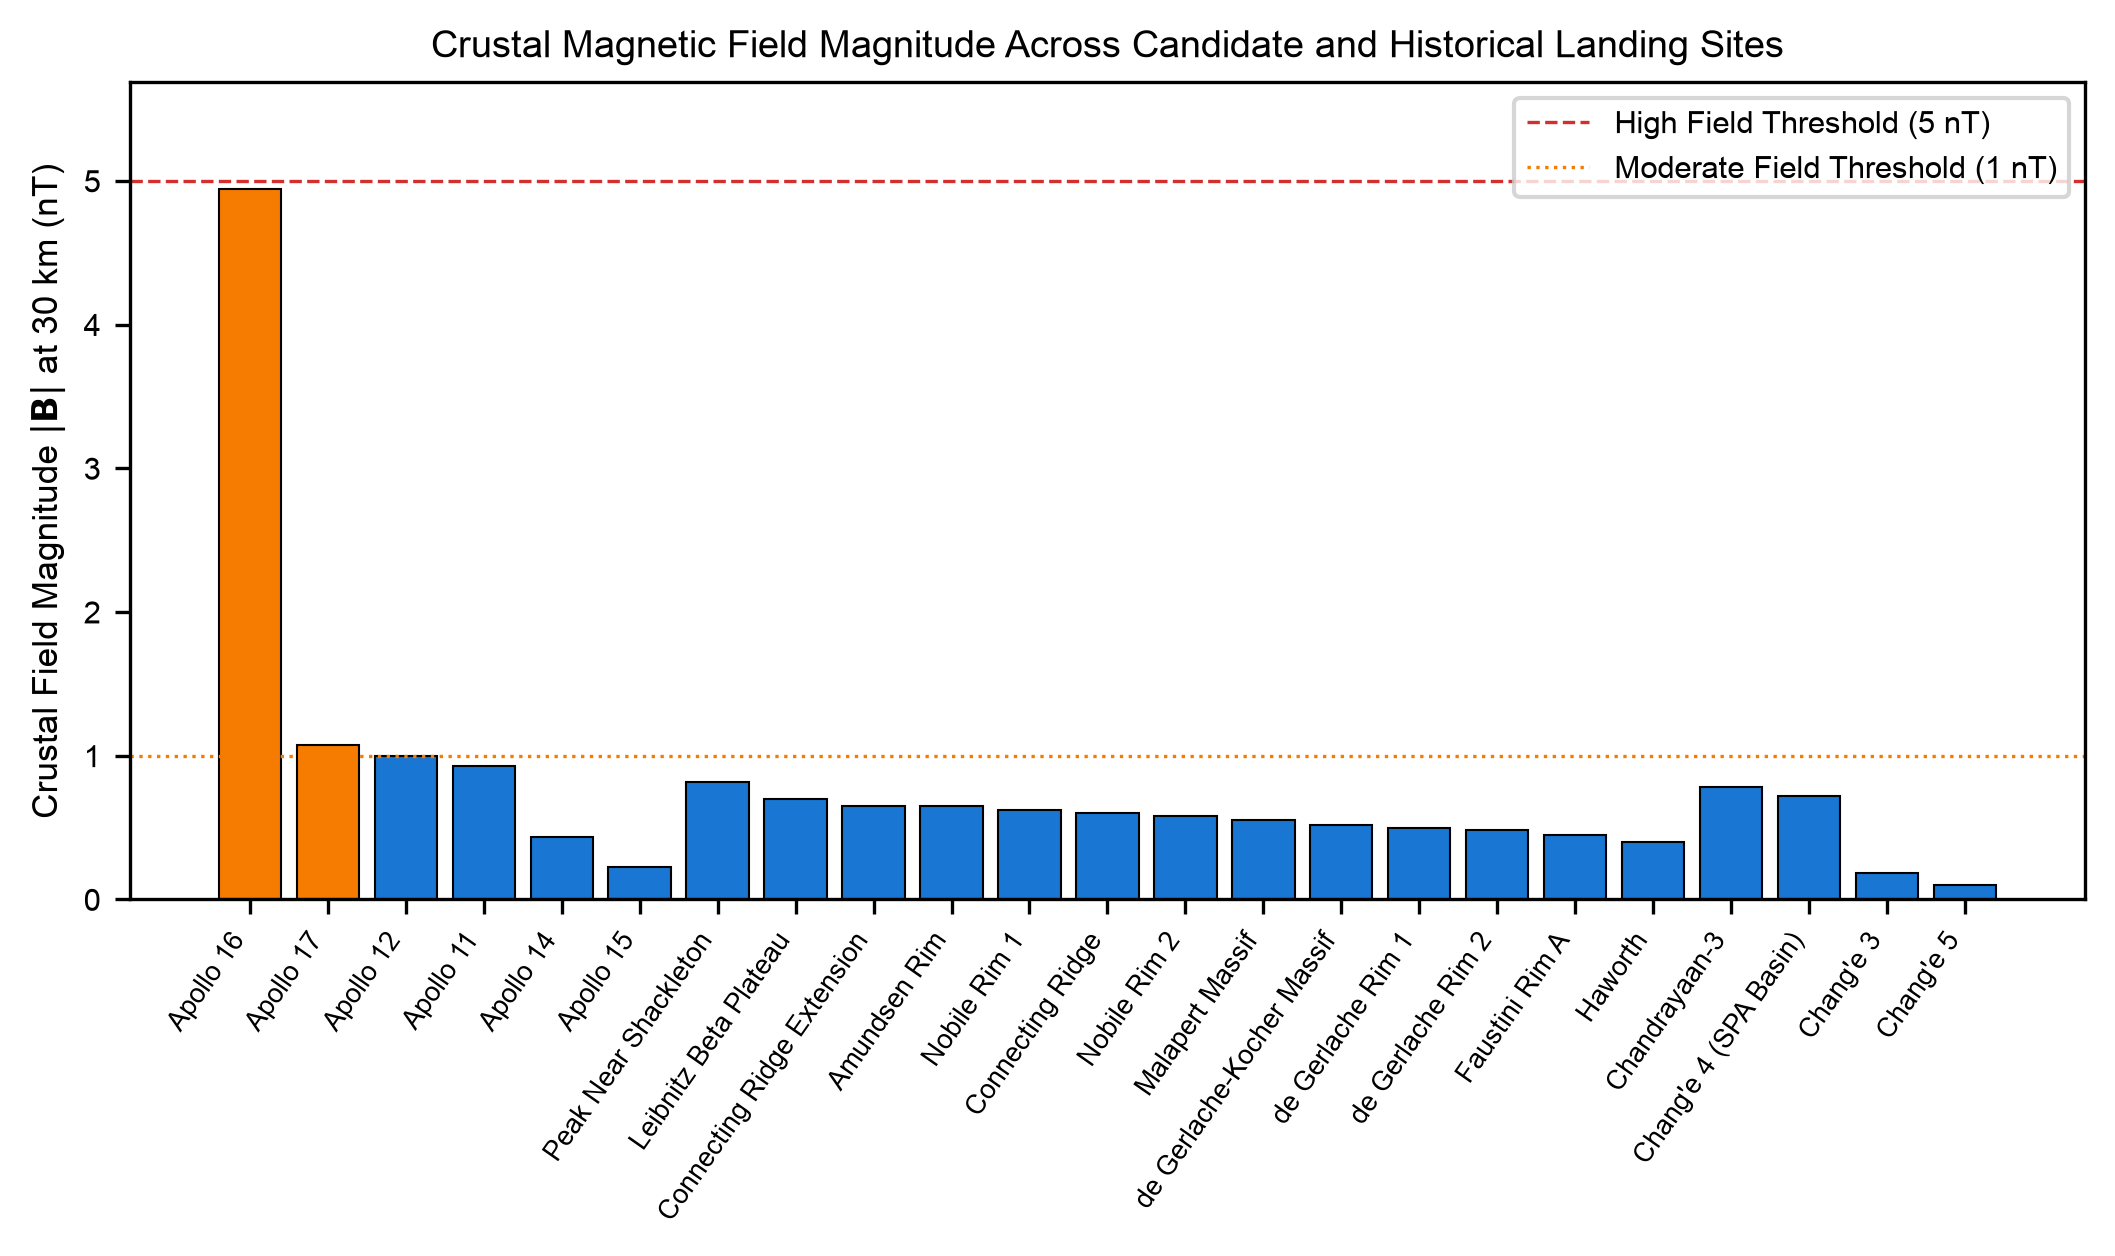
Figure 4 | Quantitative comparison of magnetic field magnitude (|B|) at 30 km altitude across landing sites. Color-coded by biological regime: Blue = Low/Null-Field (< 1.0 nT); Orange = Moderate Field (1–5 nT); Red = High Field (> 5.0 nT).
Key Insights:
- Artemis III Uniformity: All Artemis III candidate zones register between 0.40 nT (Haworth) and 0.82 nT (Peak Near Shackleton), placing them squarely in the near-null hypomagnetic category.
- Chang’e 4 (Far Side): Chang’e 4 in the Von Kármán crater experiences elevated regional fields (~8.65 nT) due to its location within the South Pole-Aitken basin anomaly complex.
Figure 5: Biological Evidence Matrix of Hypomagnetic Stress
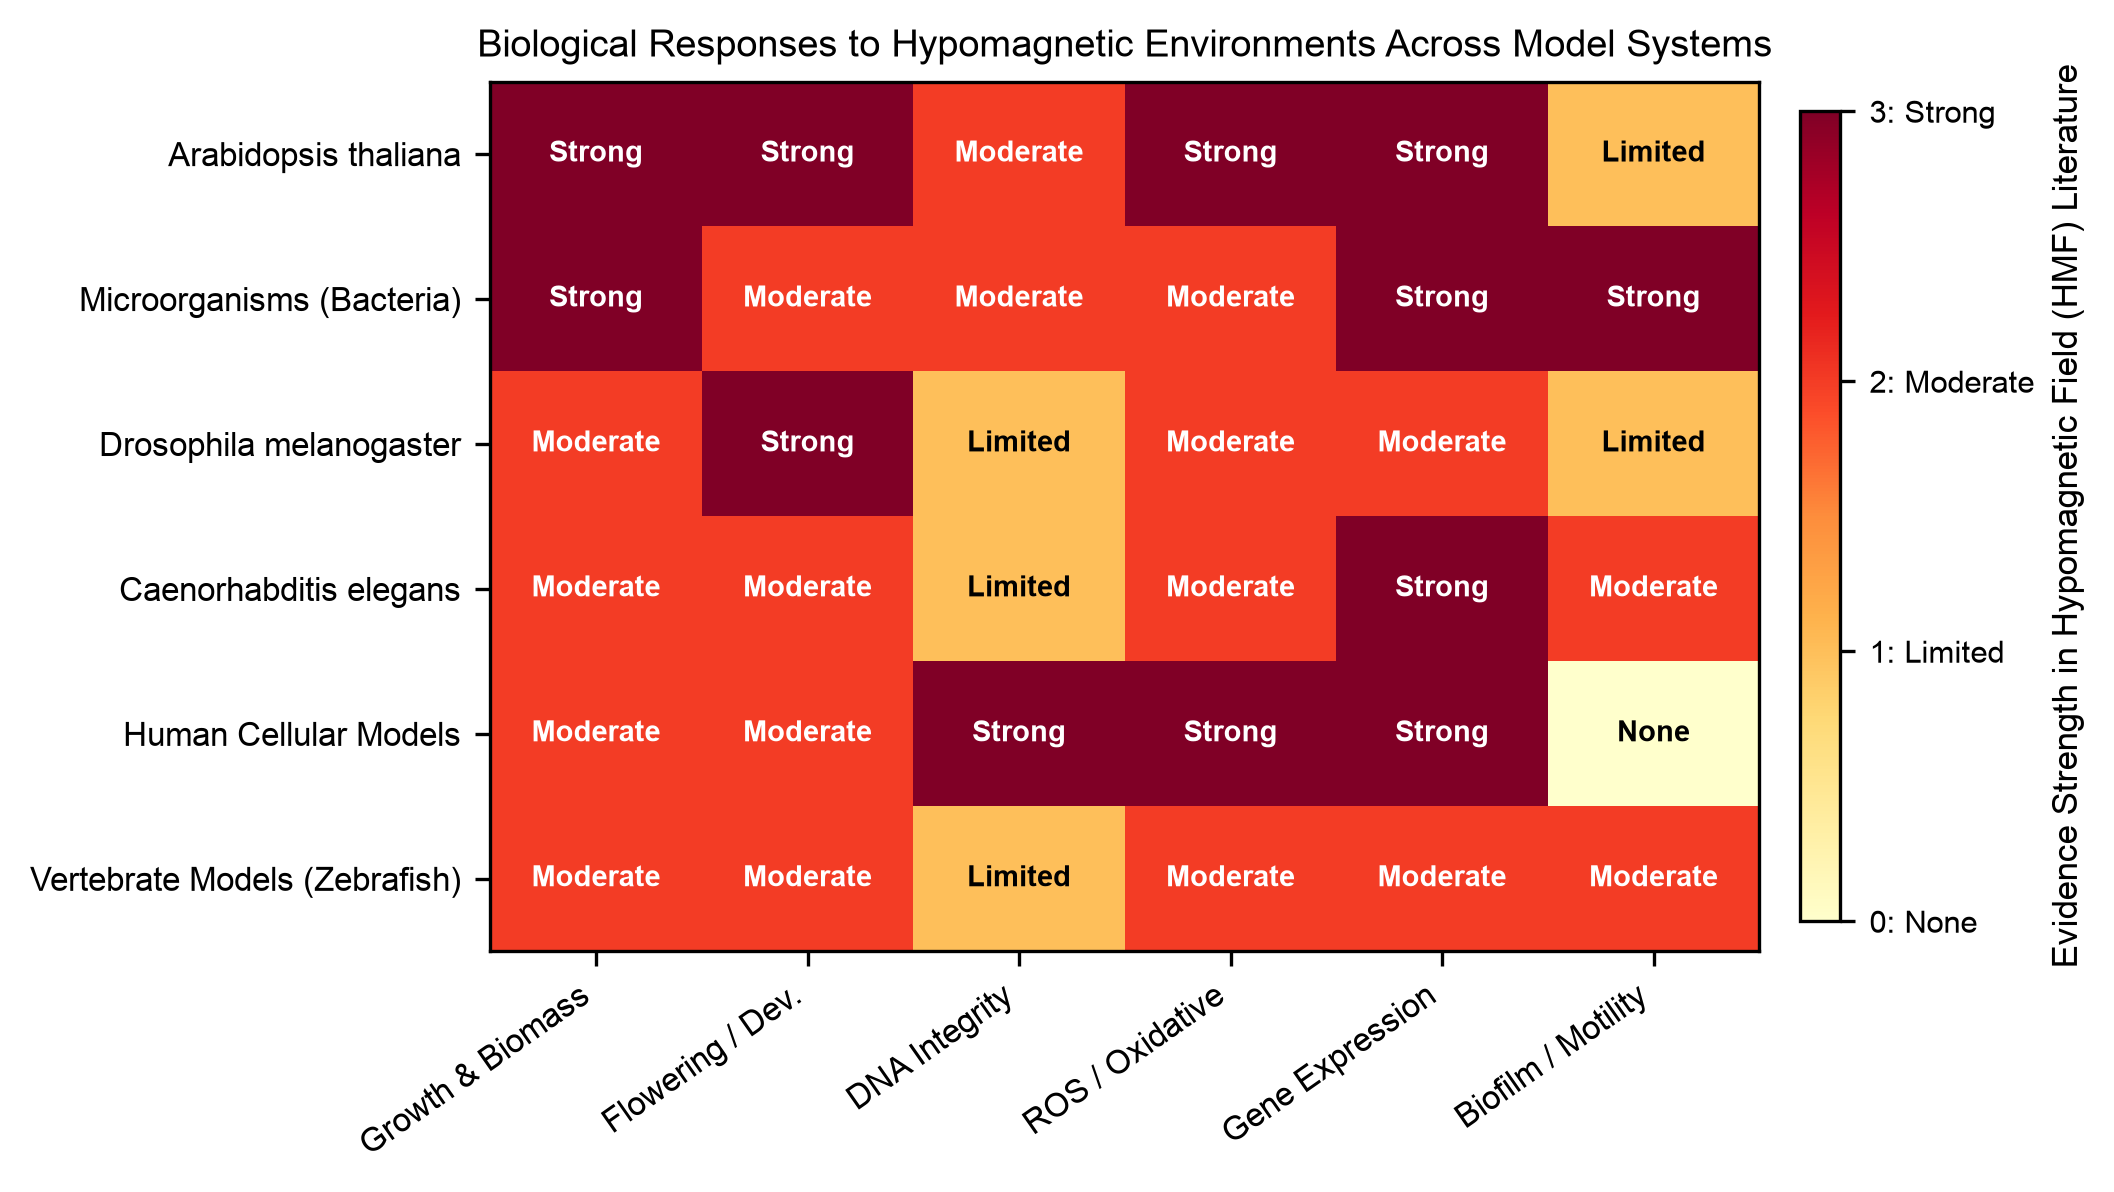
Figure 5 | Systematic review matrix of biological responses to hypomagnetic field (HMF) conditions (< 1 µT). Evidence strength scores synthesized across peer-reviewed empirical studies spanning plants, microbes, invertebrates, mammals, and human cell cultures.
Key Biological Takeaways:
- Plant Morphogenesis & Auxin Transport: Near-null magnetic shielding (< 1 µT) disrupts PIN2 polar auxin transport, delays Arabidopsis flowering transitions (CRY/PHY pathway modulation), perturbs iron homeostasis, and triggers elevated reactive oxygen species (ROS) accumulation.
- Cellular Radical Pair Mechanism: Magnetic field absence alters radical pair spin-state recombination kinetics (singlet-triplet yield ratios), impacting cryptochrome signaling and cellular DNA repair efficiency.
- Mammalian & Human Health Risks: HMF shielding accelerates osteoblast demineralization (exacerbating microgravity-induced bone loss), alters circadian clock gene transcription (BMAL1/PER2), and alters microcirculatory blood flow.
Supplementary Details: South Polar Detail & Field Distribution
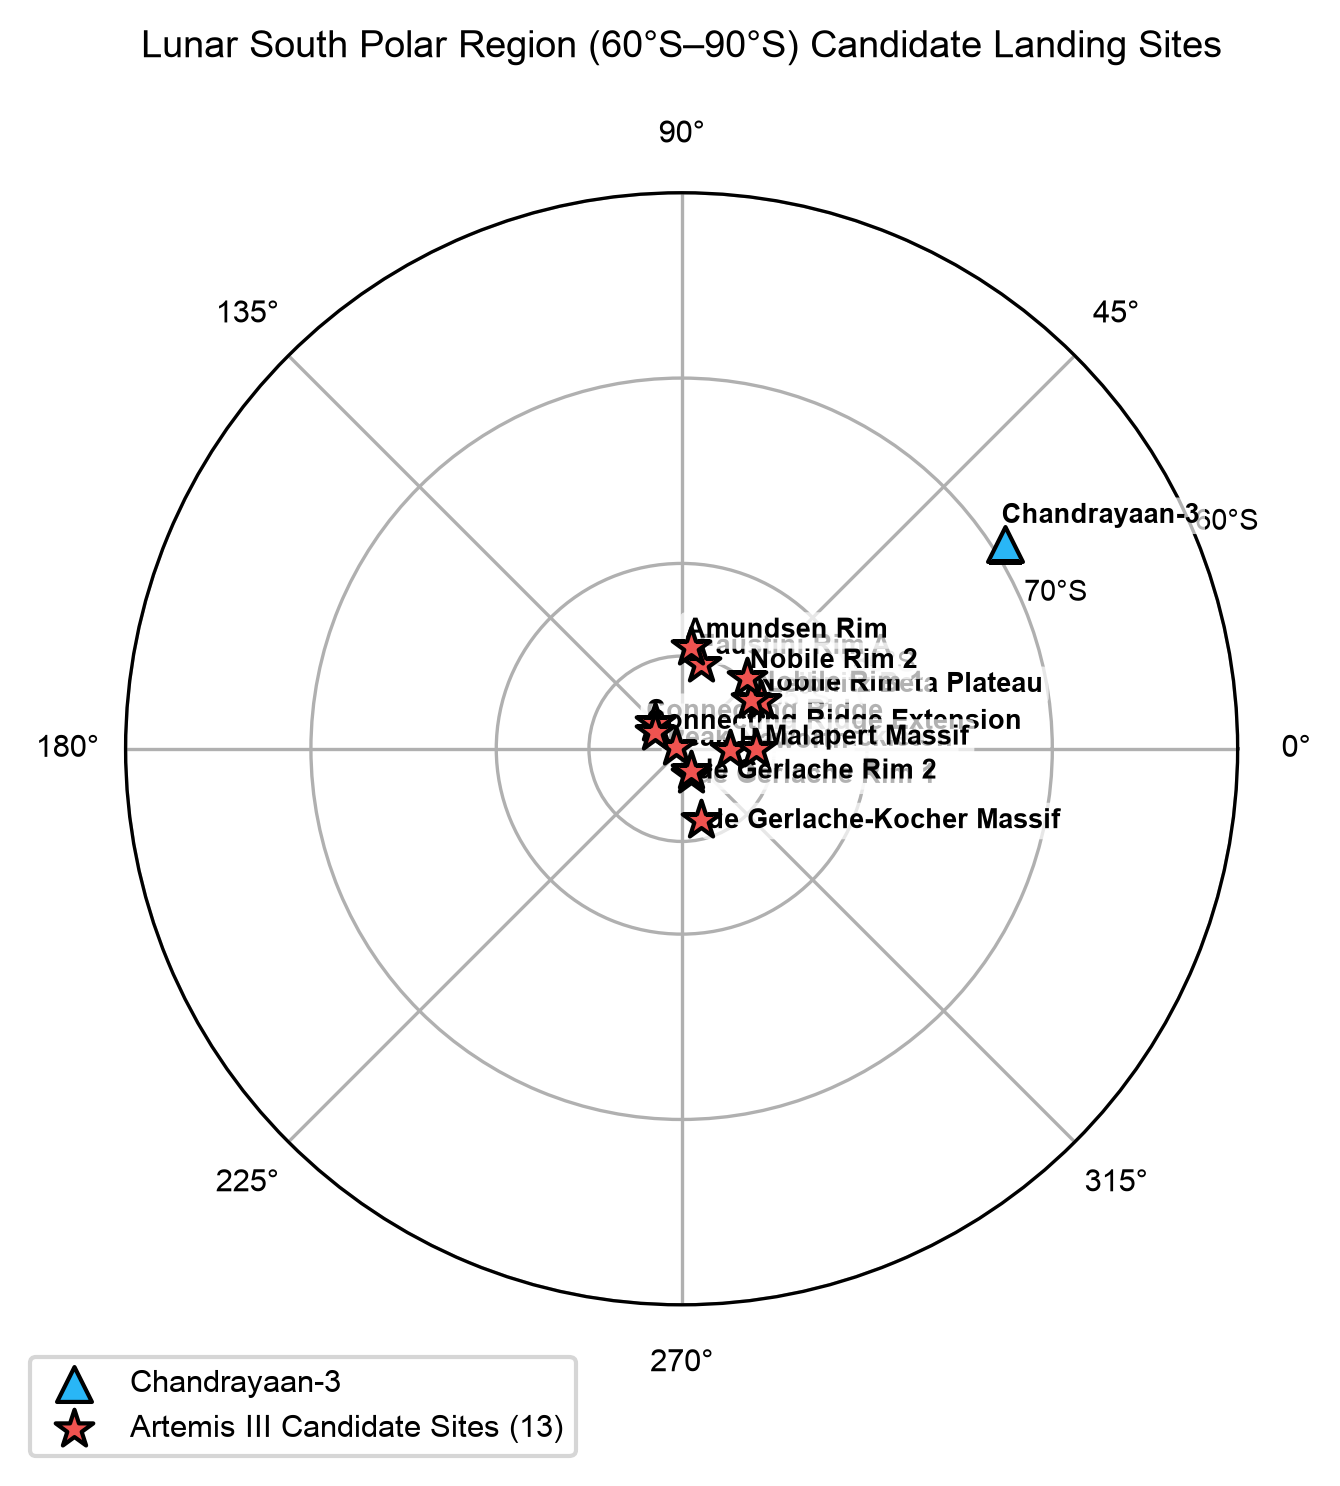
Figure S1 | Artemis III South Pole Stereographic Map. High-resolution magnetic topography (80°S to 90°S) showing candidate landing sites relative to polar crater rims and permanently shadowed regions (PSRs).
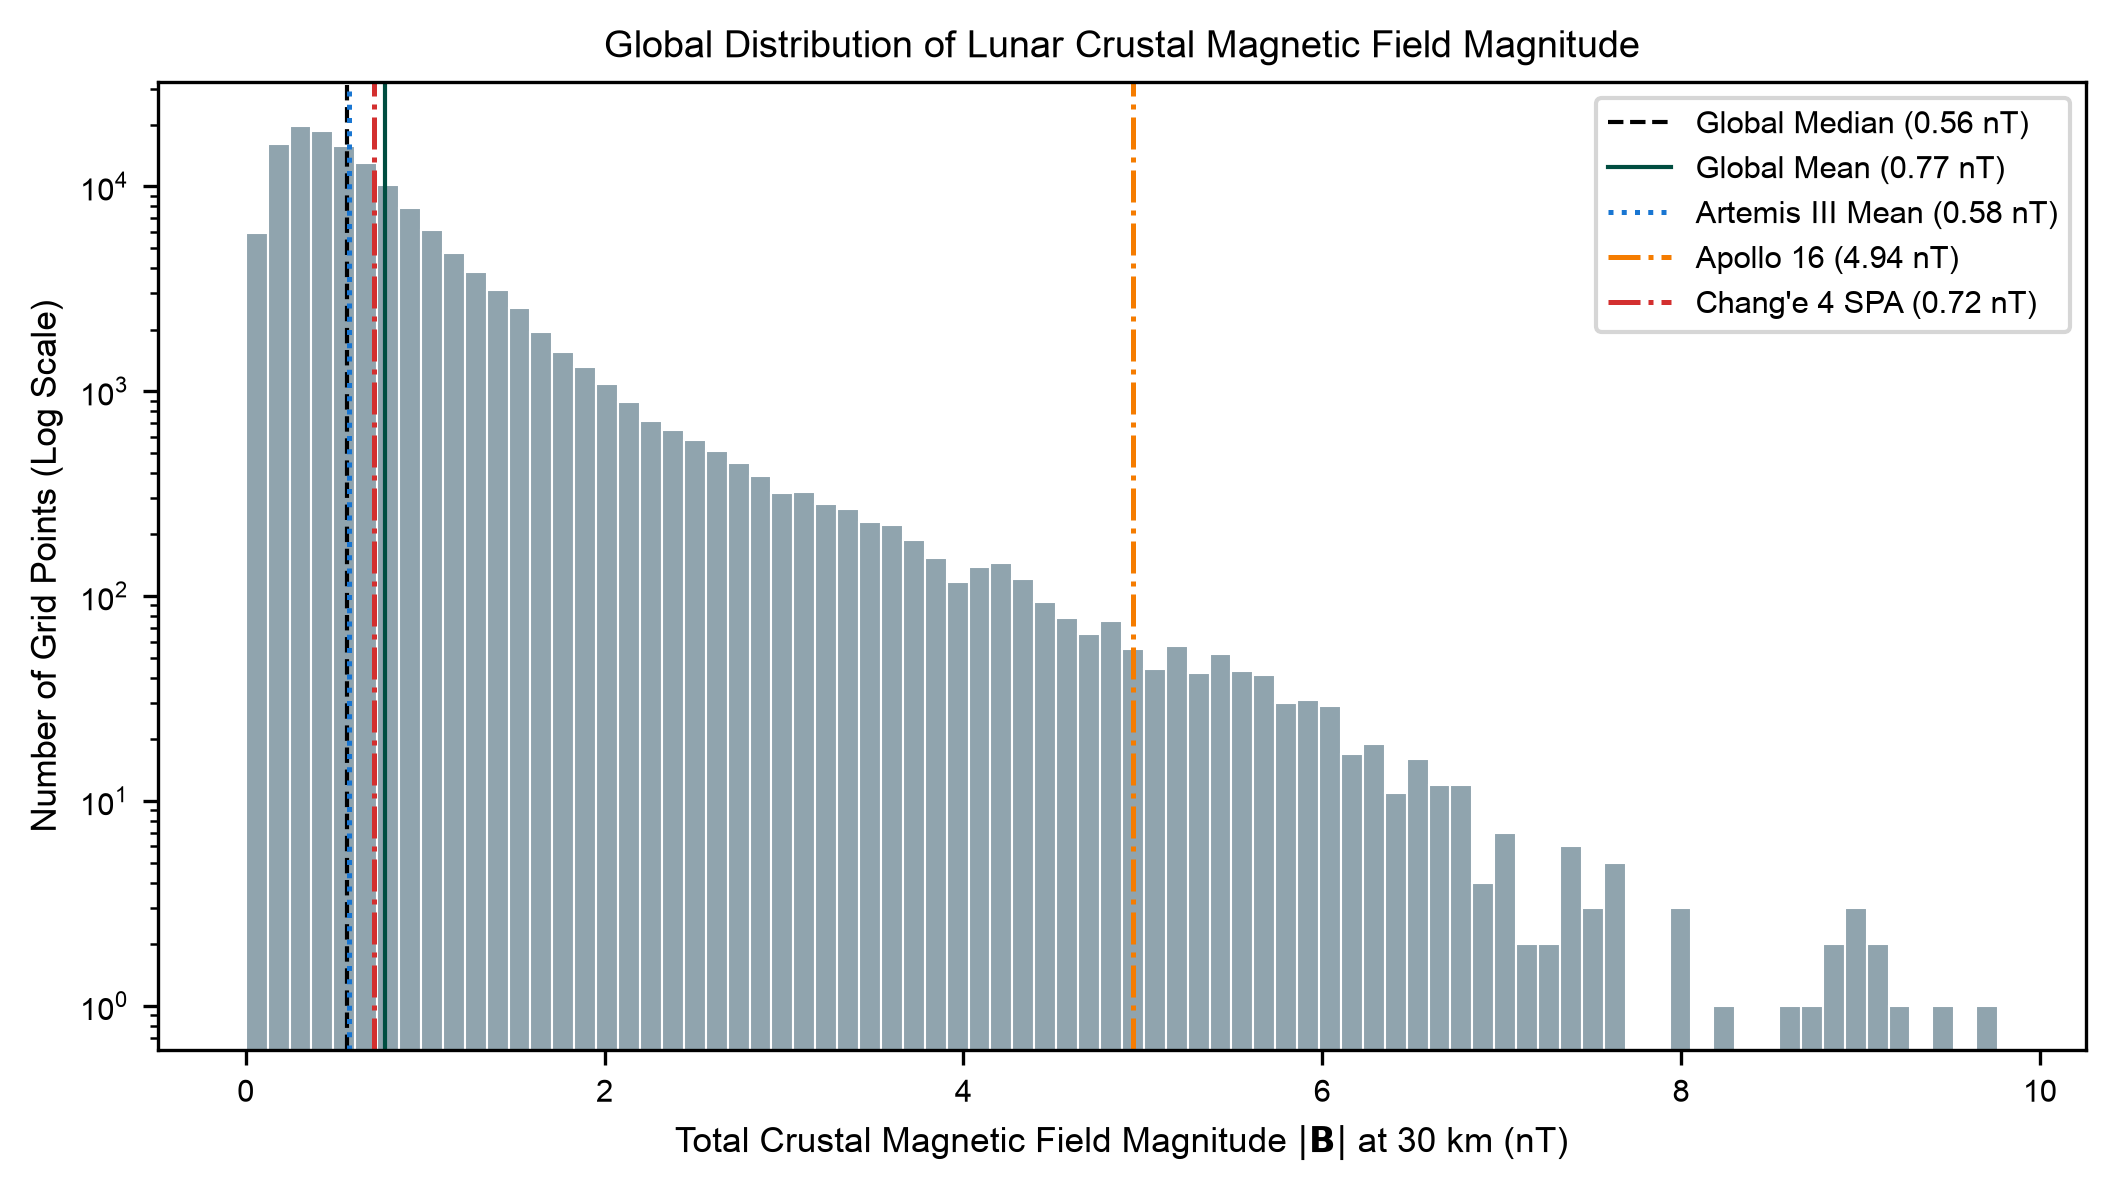
Figure S2 | Global Field Intensity Distribution. Log-normal distribution of total magnetic field magnitude |B| across 140,000+ spatial bins at 30 km altitude, demonstrating that >95% of the lunar surface is hypomagnetic.
🛠️ Interactive Tools & Resources
- 🌐 3D Interactive WebGL Moon Globe — Rotate and query global crustal magnetic field heatmaps with clickable landing site markers.
- 📊 Landing Site Data Explorer — Filter, sort, and export magnetic field measurements for all 23 landing sites to CSV.
- 📄 Manuscript & Supplementary Information — Download full manuscript PDF (npj Microgravity format) and access complete LaTeX sources.
- 💻 GitHub Repository — Reproducible Python analysis scripts, raw data processing pipelines, and figure generators.