- description: >-
OSDR has incorporated additional data to support spaceflight experiments. Linking changes to the environment and changes in biological data can lead to
many discoveries.
Environmental Data for Space Biology Rodent Research
The Environmental Data Application (EDA App)
{”https://visualization.osdr.nasa.gov/eda/”}
The Environmental Data Application (EDA) provides users with convenient access to valuable data collected during the Rodent research missions. The application facilitates the exploration and analysis of this scientific data, offering a comprehensive view of the mission details, telemetry information, and relevant radiation-related metadata.
Mission Information: The EDA application provides detailed information about each Rodent research mission. This includes mission objectives, launch dates, spacecraft specifications, and key scientific instruments onboard the spacecraft. Users can easily access this information to gain an overview of the mission context and objectives.
Telemetry Data: Telemetry data, also known as engineering data, is crucial for monitoring the health and status of the spacecraft. The EDA application allows users to access and analyze this data, which includes information such as spacecraft temperatures, power levels, and attitude control parameters. Telemetry data is essential for assessing the performance of the spacecraft and identifying any potential issues.
Radiation-Related Metadata: Radiation is a significant factor in space exploration, and the Rodent research missions collected valuable data on radiation levels and effects. The EDA application provides radiation data, including information on radiation types, doses, and sources. This data is valuable for studying the effects of radiation on spacecraft components and biological organisms, such as rodents.
User-Friendly Interface: The EDA application is designed with a user-friendly interface, making it accessible to researchers and the public alike. Users can easily navigate the application, search for specific data, and visualize the information through interactive plots and graphs. The application also provides documentation and tutorials to assist users in making the most of the available data.
Data Export and Sharing: The EDA application allows users to export the data they need for further analysis or sharing with collaborators. Data can be exported in various formats, including CSV, JSON, and NetCDF, ensuring compatibility with a wide range of scientific software and tools. Additionally, users can share their work with others by publishing their results or creating custom visualizations within the application.
Key elements of the EDA application:
The EDA application promotes scientific exploration by providing access to Rodent research mission data. The application provides interactive access to the environmental data and enables a comprehensive understanding of the environmental factors associated with space exploration.
The telemetry data includes the sample’s temperature, humidity, and CO2 environmental metadata.
The user can select “Display Mission milestones” to add these important concepts to help add context to the data generated from the processed samples.
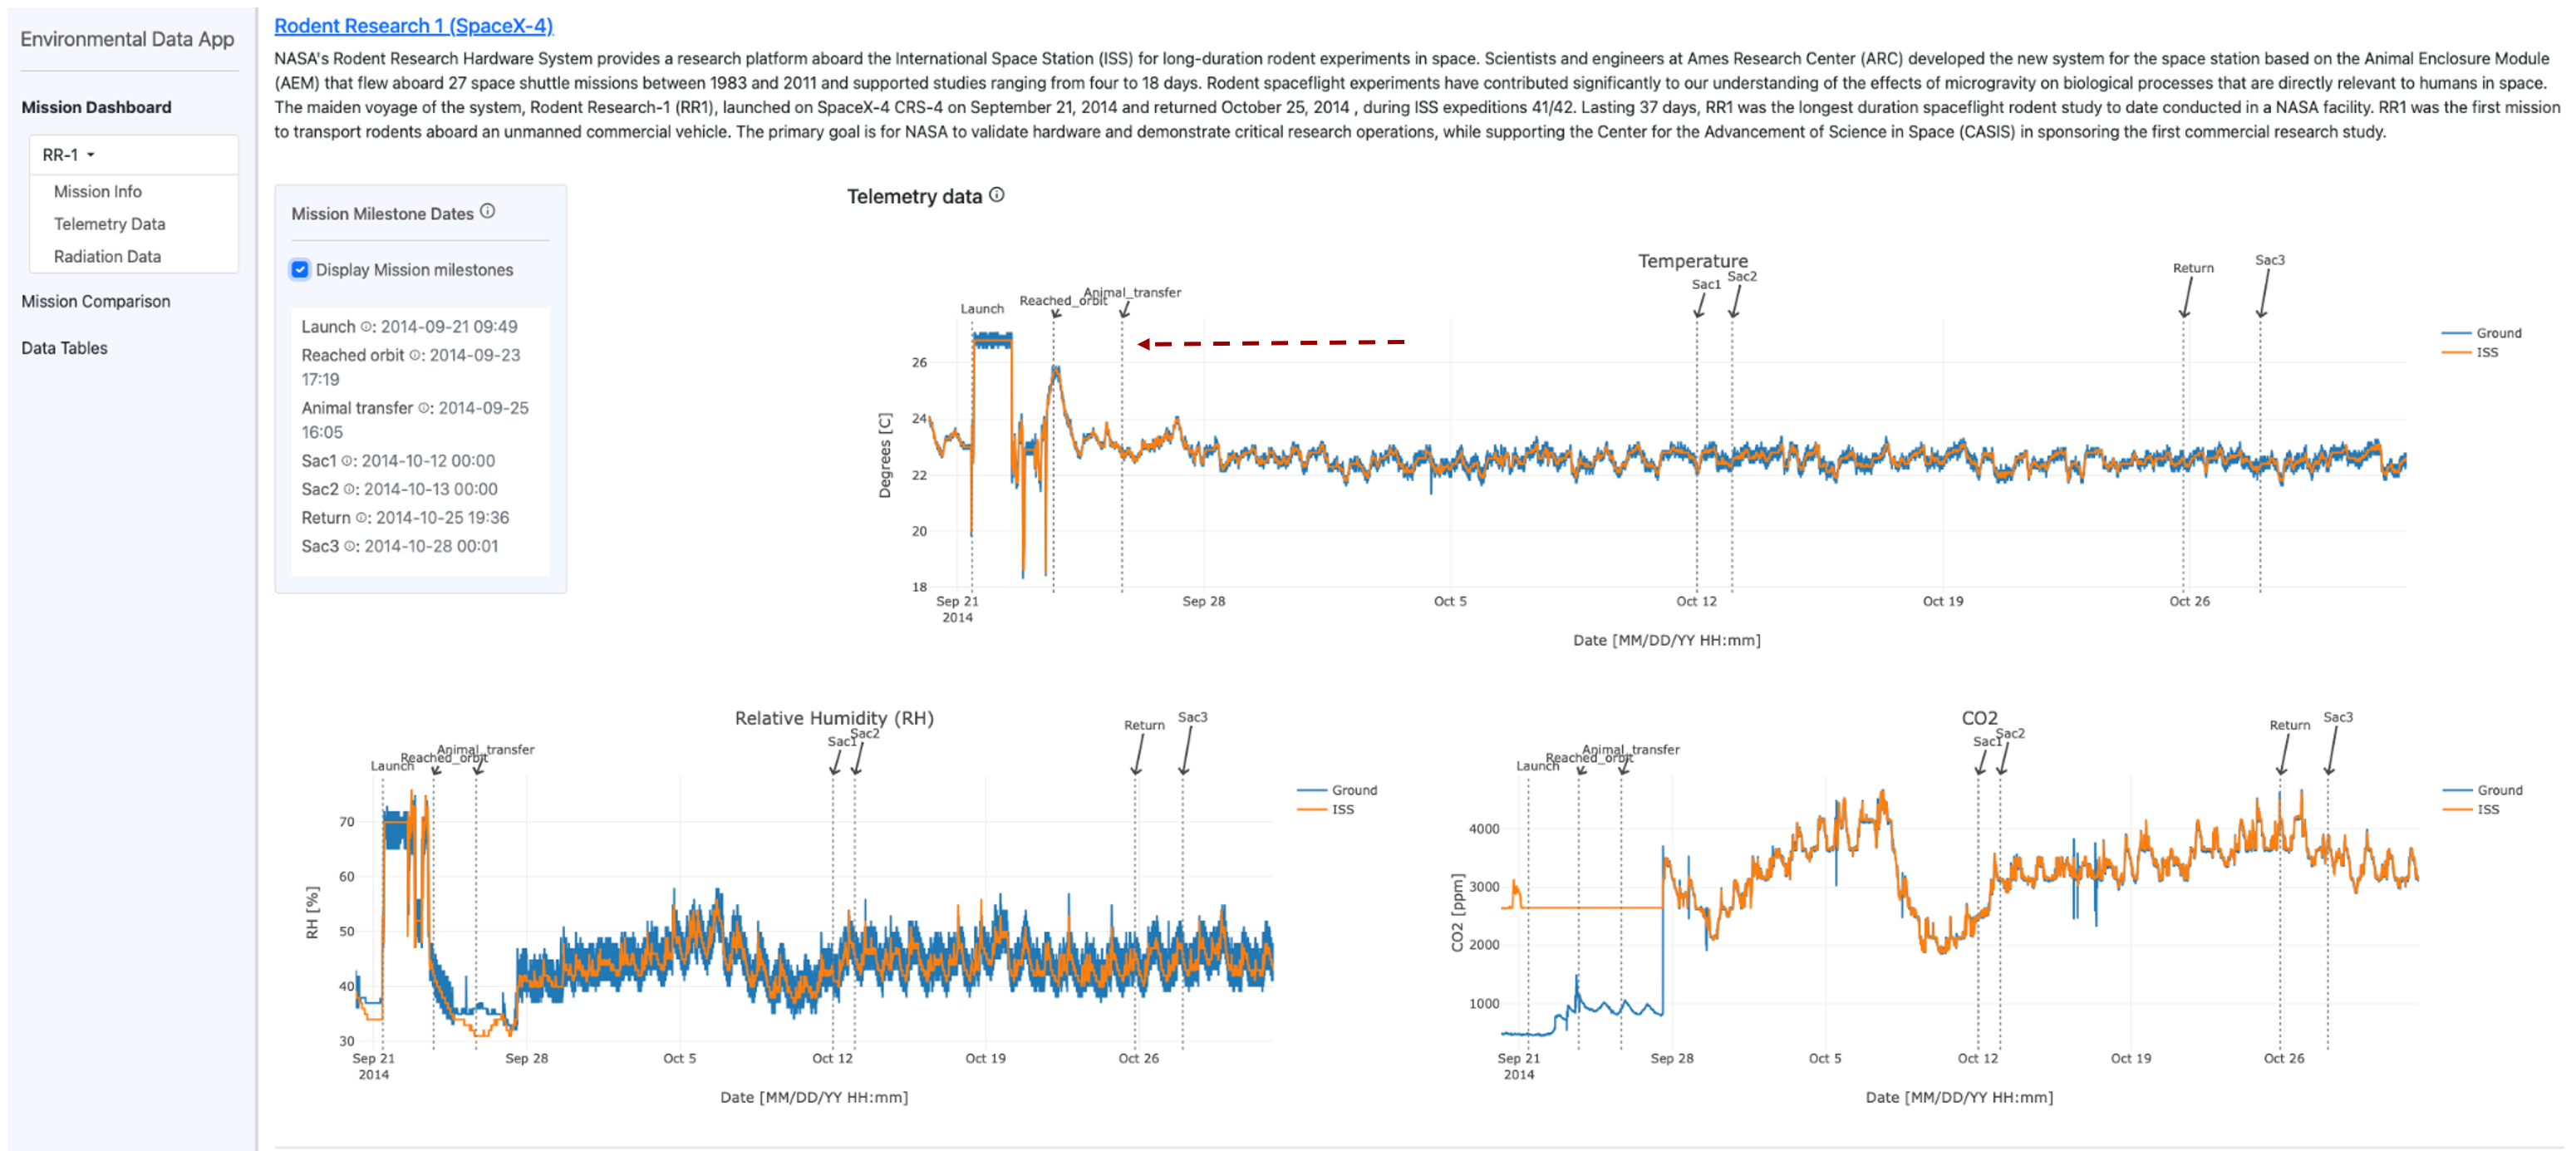
Mulitple line graphs are displayed on a screen, depicting environmental data collected during rodent research mission 1. Line graphs are employed to illustrate temperature-related trends over time. The second graph is also a line graph, presenting humidity data. The third graph is a line graph that displays CO2 data gathered throughout the duration of the experiment. A red arrow draws attention to the "Display Mission Milestone" button.
Radiation meta-data
In this tutorial, we will explore how to access the data presented in the line graphs related to radiation dose. These graphs provide valuable information on accumulated radiation dose, total radiation dose, South Atlantic anomaly, and galactic cosmic rays. By following the steps below, you can easily access and interpret the data from these graphs.
Scroll down to view the Graphs: The line graphs are titled “Accumulated Radiation Dose,” “Total Radiation Dose,” “South Atlantic Anomaly,” and “Galactic Cosmic Rays.”
Understand the Data: Each graph displays a line representing the data points. The x-axis typically represents time, while the y-axis represents the radiation dose or related measurements. Read the titles and labels on the axes to understand what each graph is measuring.
Interpret the Accumulated Radiation Dose Graph: Examine the “Accumulated Radiation Dose” graph to observe the trend of accumulated radiation dose over time. Pay attention to any significant changes or patterns in the line.
Analyze the Total Radiation Dose Graph: Study the “Total Radiation Dose” graph to understand the total radiation dose received over time. Compare the total radiation dose with the accumulated radiation dose to identify any differences.
.png)
Screenshot showing 4 lines graphs depicting the radiation environmental metadata collected. Three-line graphs are displayed on a screen, depicting environmental data collected during rodent research mission 1. Line graphs are employed to illustrate “Galactic Cosmic Ray” trends over time. The second graph is also a line graph, presenting data related to the “South Atlantic Anomaly”. The third graph is a line graph that displays the “Accumulated Radiation Dose” data gathered throughout the duration of the experiment. The fourth graph is the “Total Radiation Dose” measure during their Mission. All graphs displayed mission miles stones.
Select 1 or more Rodent Research (RR) missions.
To compare different RR mission environment data please select the RR mission # of interest from the provided options. Upon selection, the corresponding data will be displayed on the line graph.
In the provided example, you can observe the temperature to which the samples were exposed during their respective missions.
Below the bar plot is a concise summary of this data, which can be downloaded for further analysis. The red arrows indicate the options for adding or removing data from a selection of RR missions.
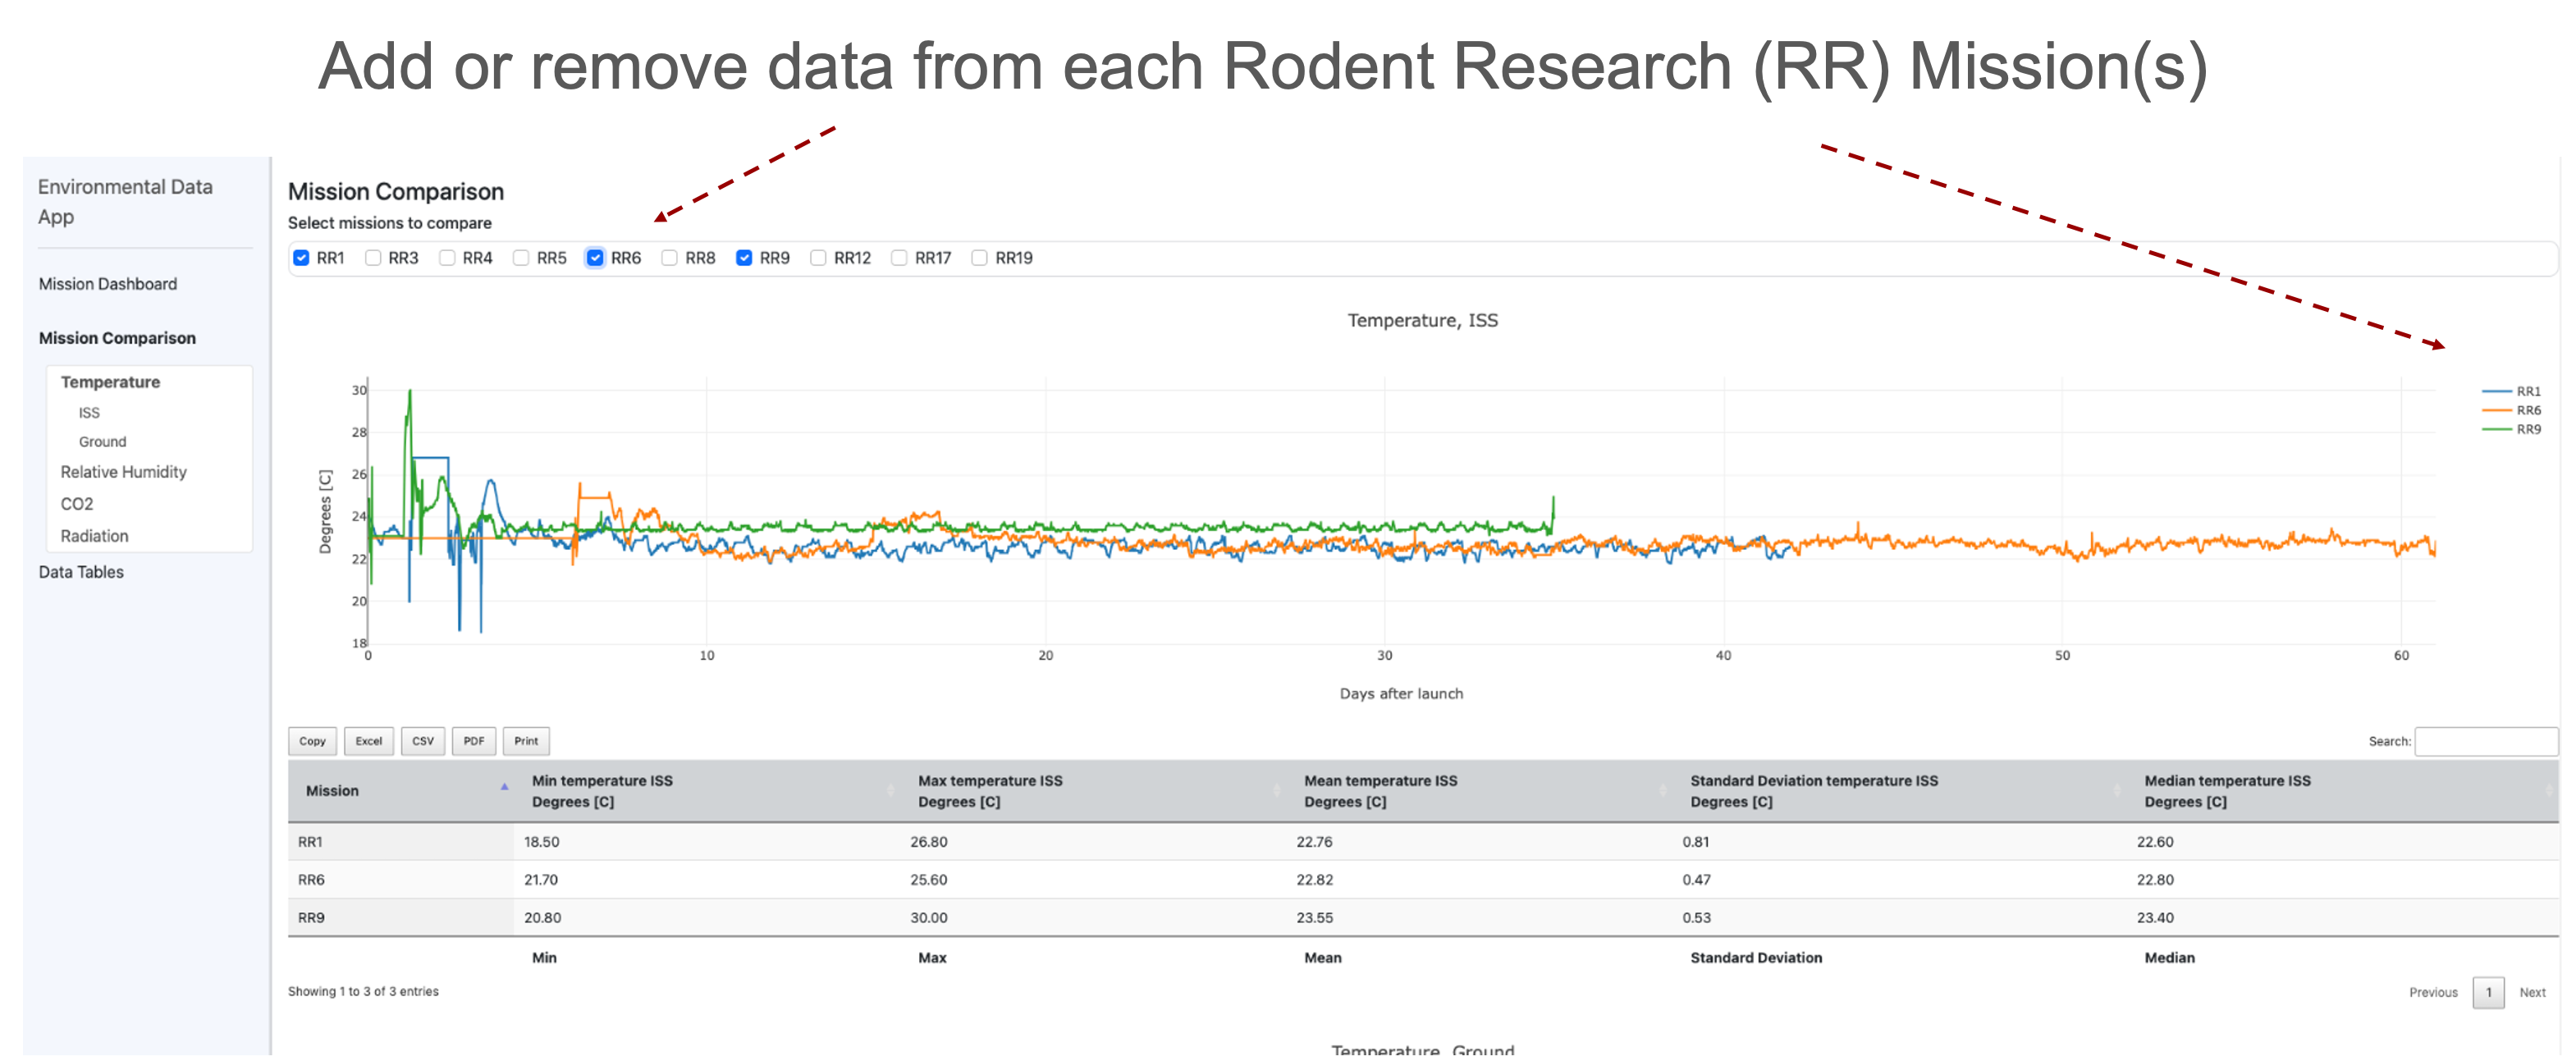
A screenshot showing a line graph comprising of 3 lines depicting environmental data collected during RR1, RR9 and RR9. Line graphs are employed to illustrate temperature data gathered throughout the duration of the experiment. There is a table below that allows the user download the raw data in a variety of different formats including .CSV, .PDF, .excel, Copy or Print.
Scroll down and download tables of radiation metadata
After selecting the RR missions of interest the user can then scroll up and down in the main window to analyse the corresponding data displayed on the line graph(s). The line graphs provide a visual representation of the data, making it easier to identify trends, outliers, and relationships between different variables.
Line plots and table(s) of data for download: The application presents the selected data on the graph and also provides it for download in the table below.
In the provided example, you can observe the temperature to which the samples were exposed during their respective missions.
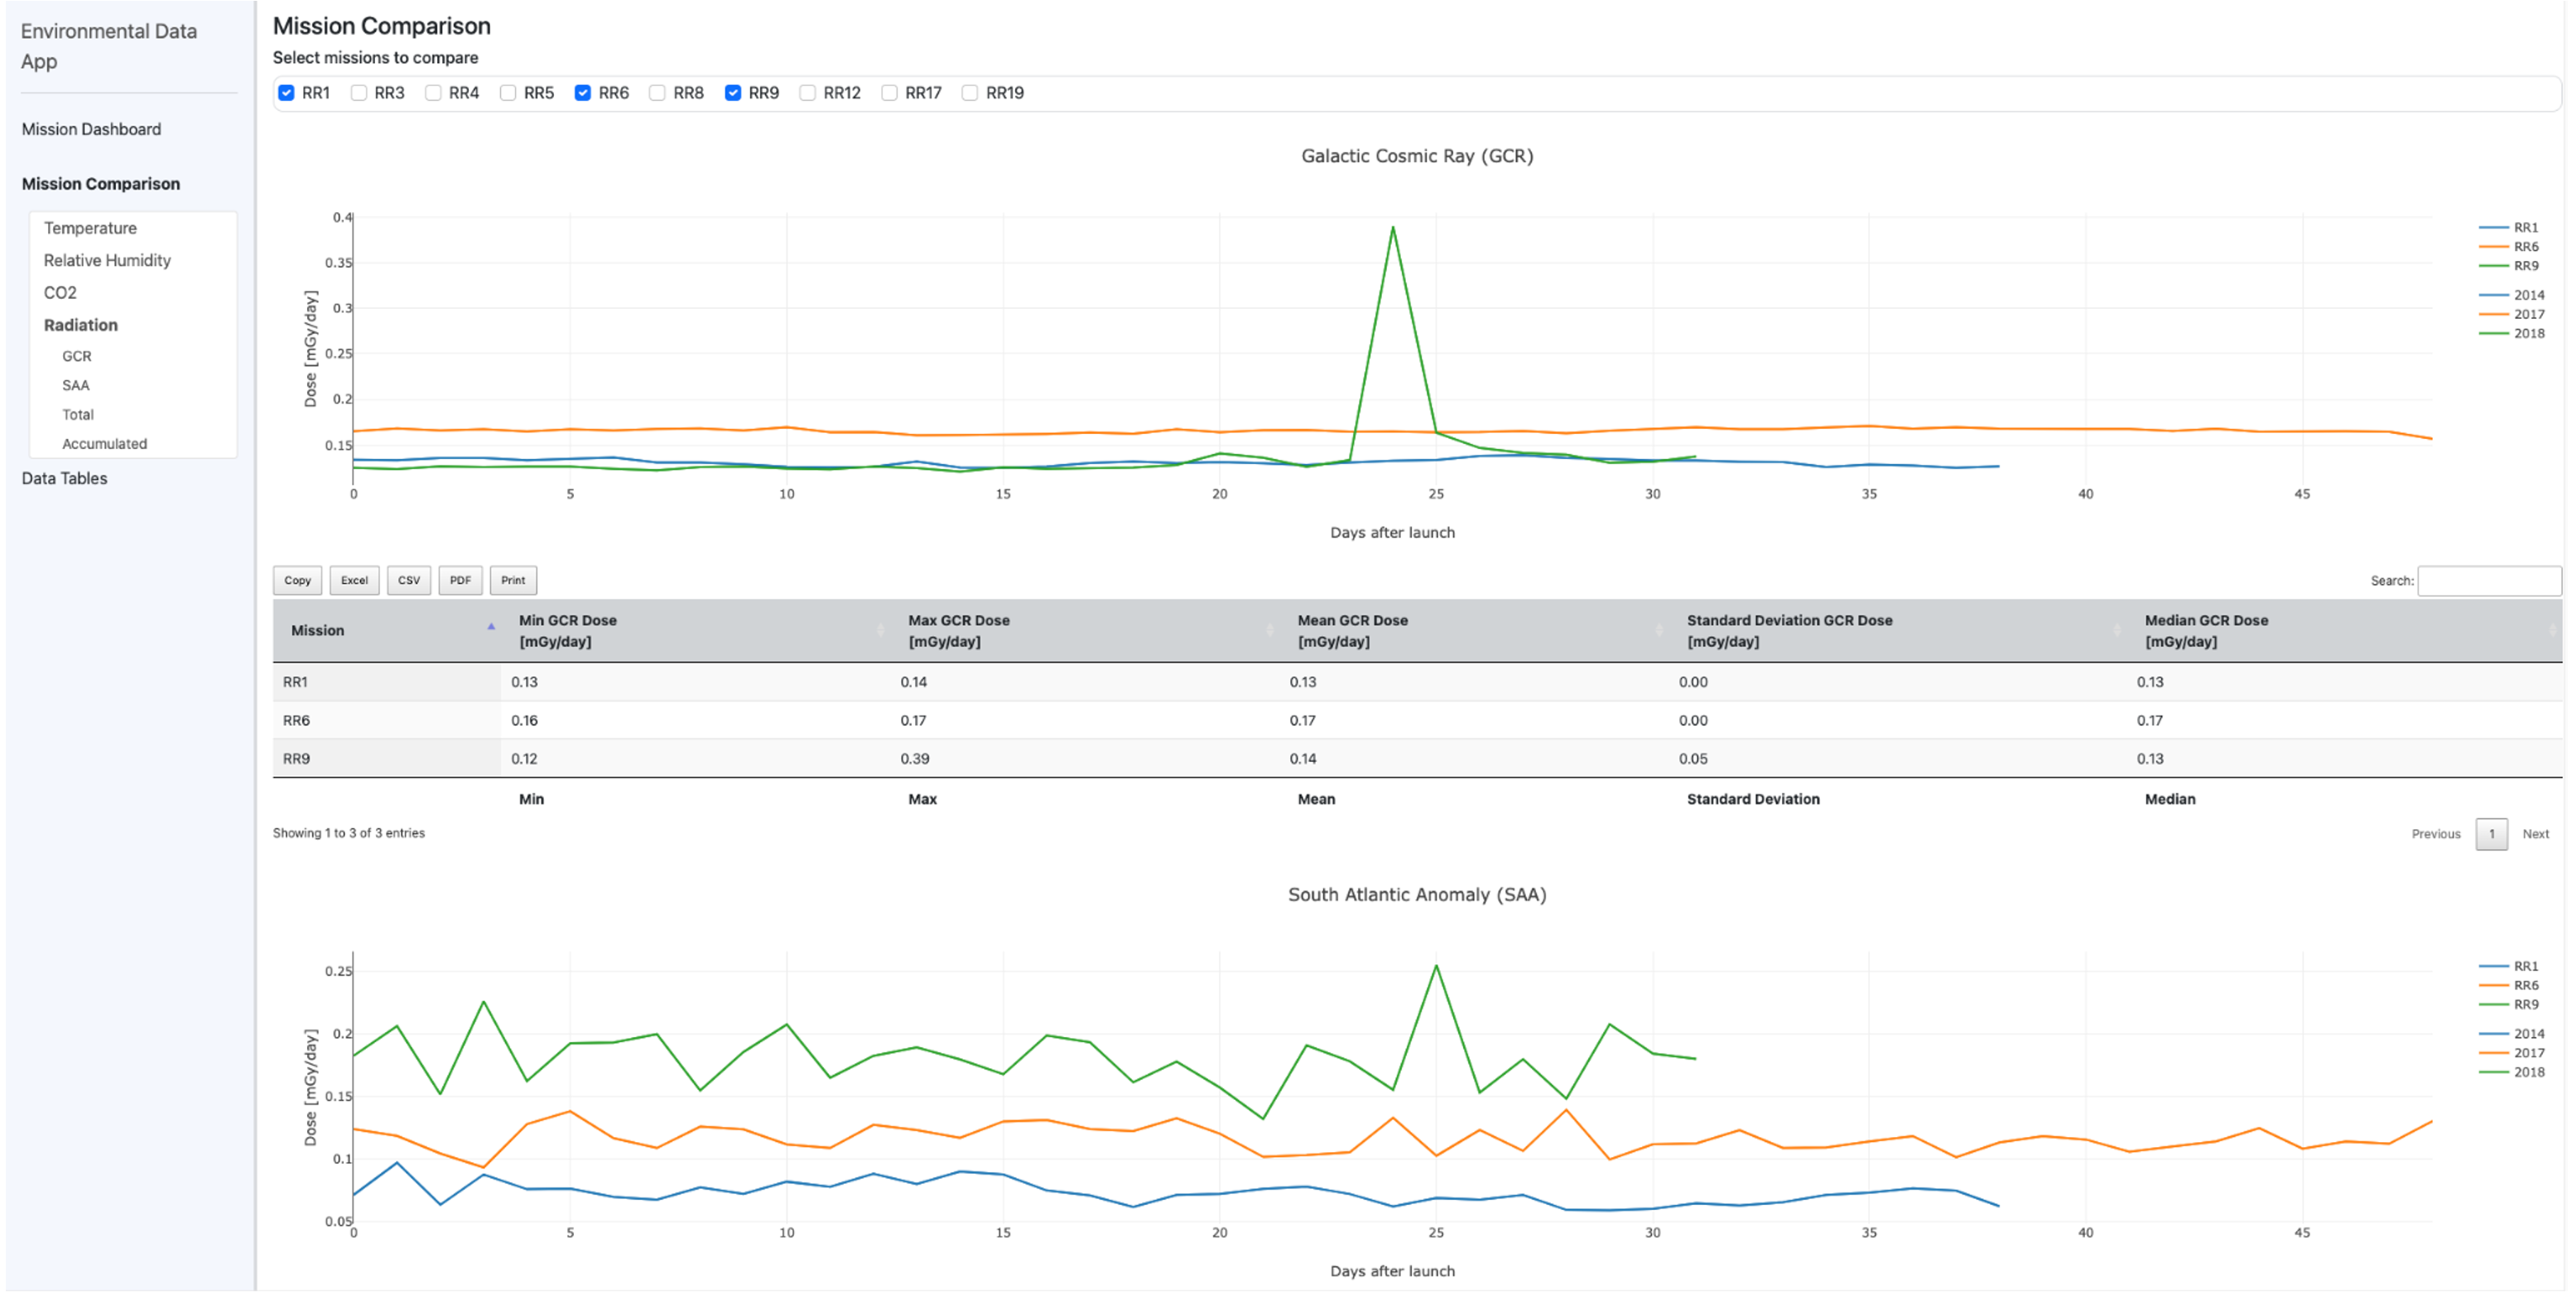
A screenshot showing a 2 line graph comprising of radiation data reacored from either Galatic cosmic rays or the from the South Atlantic Anaoly (SAA) data collected during RR1, RR9 and RR9. Line graphs are employed to illustrate temperature data gathered throughout the duration of the experiment. There is a table below that allows the user download the raw data in a variety of different formats including .CSV, .PDF, .excel, Copy or Print.
Comparison of the environmental measurements on the ISS and Ground.
The user can interact with the graph to access specific environmental data and zoom in or out of specific time periods. The comparison of CO2 levels between the ISS and the ground control offers insights into the challenges of maintaining a habitable environment in space. The left side of the interface allows the user to customize the graph by changing the environmental measurements being plotted from temperature to CO2 to relative humidity to radiation.
The user is presented with a table that contains the collected data, providing the ability to easily download it for further analysis. By adjusting the parameters, the user can gain insights into the differences and similarities between the CO2 levels in the ISS and the ground control.
In this example, we have a comparison of the carbon dioxide (CO2) levels recorded in two distinct environments: the International Space Station (ISS) during research rotation 9 (RR9) and a ground control facility.
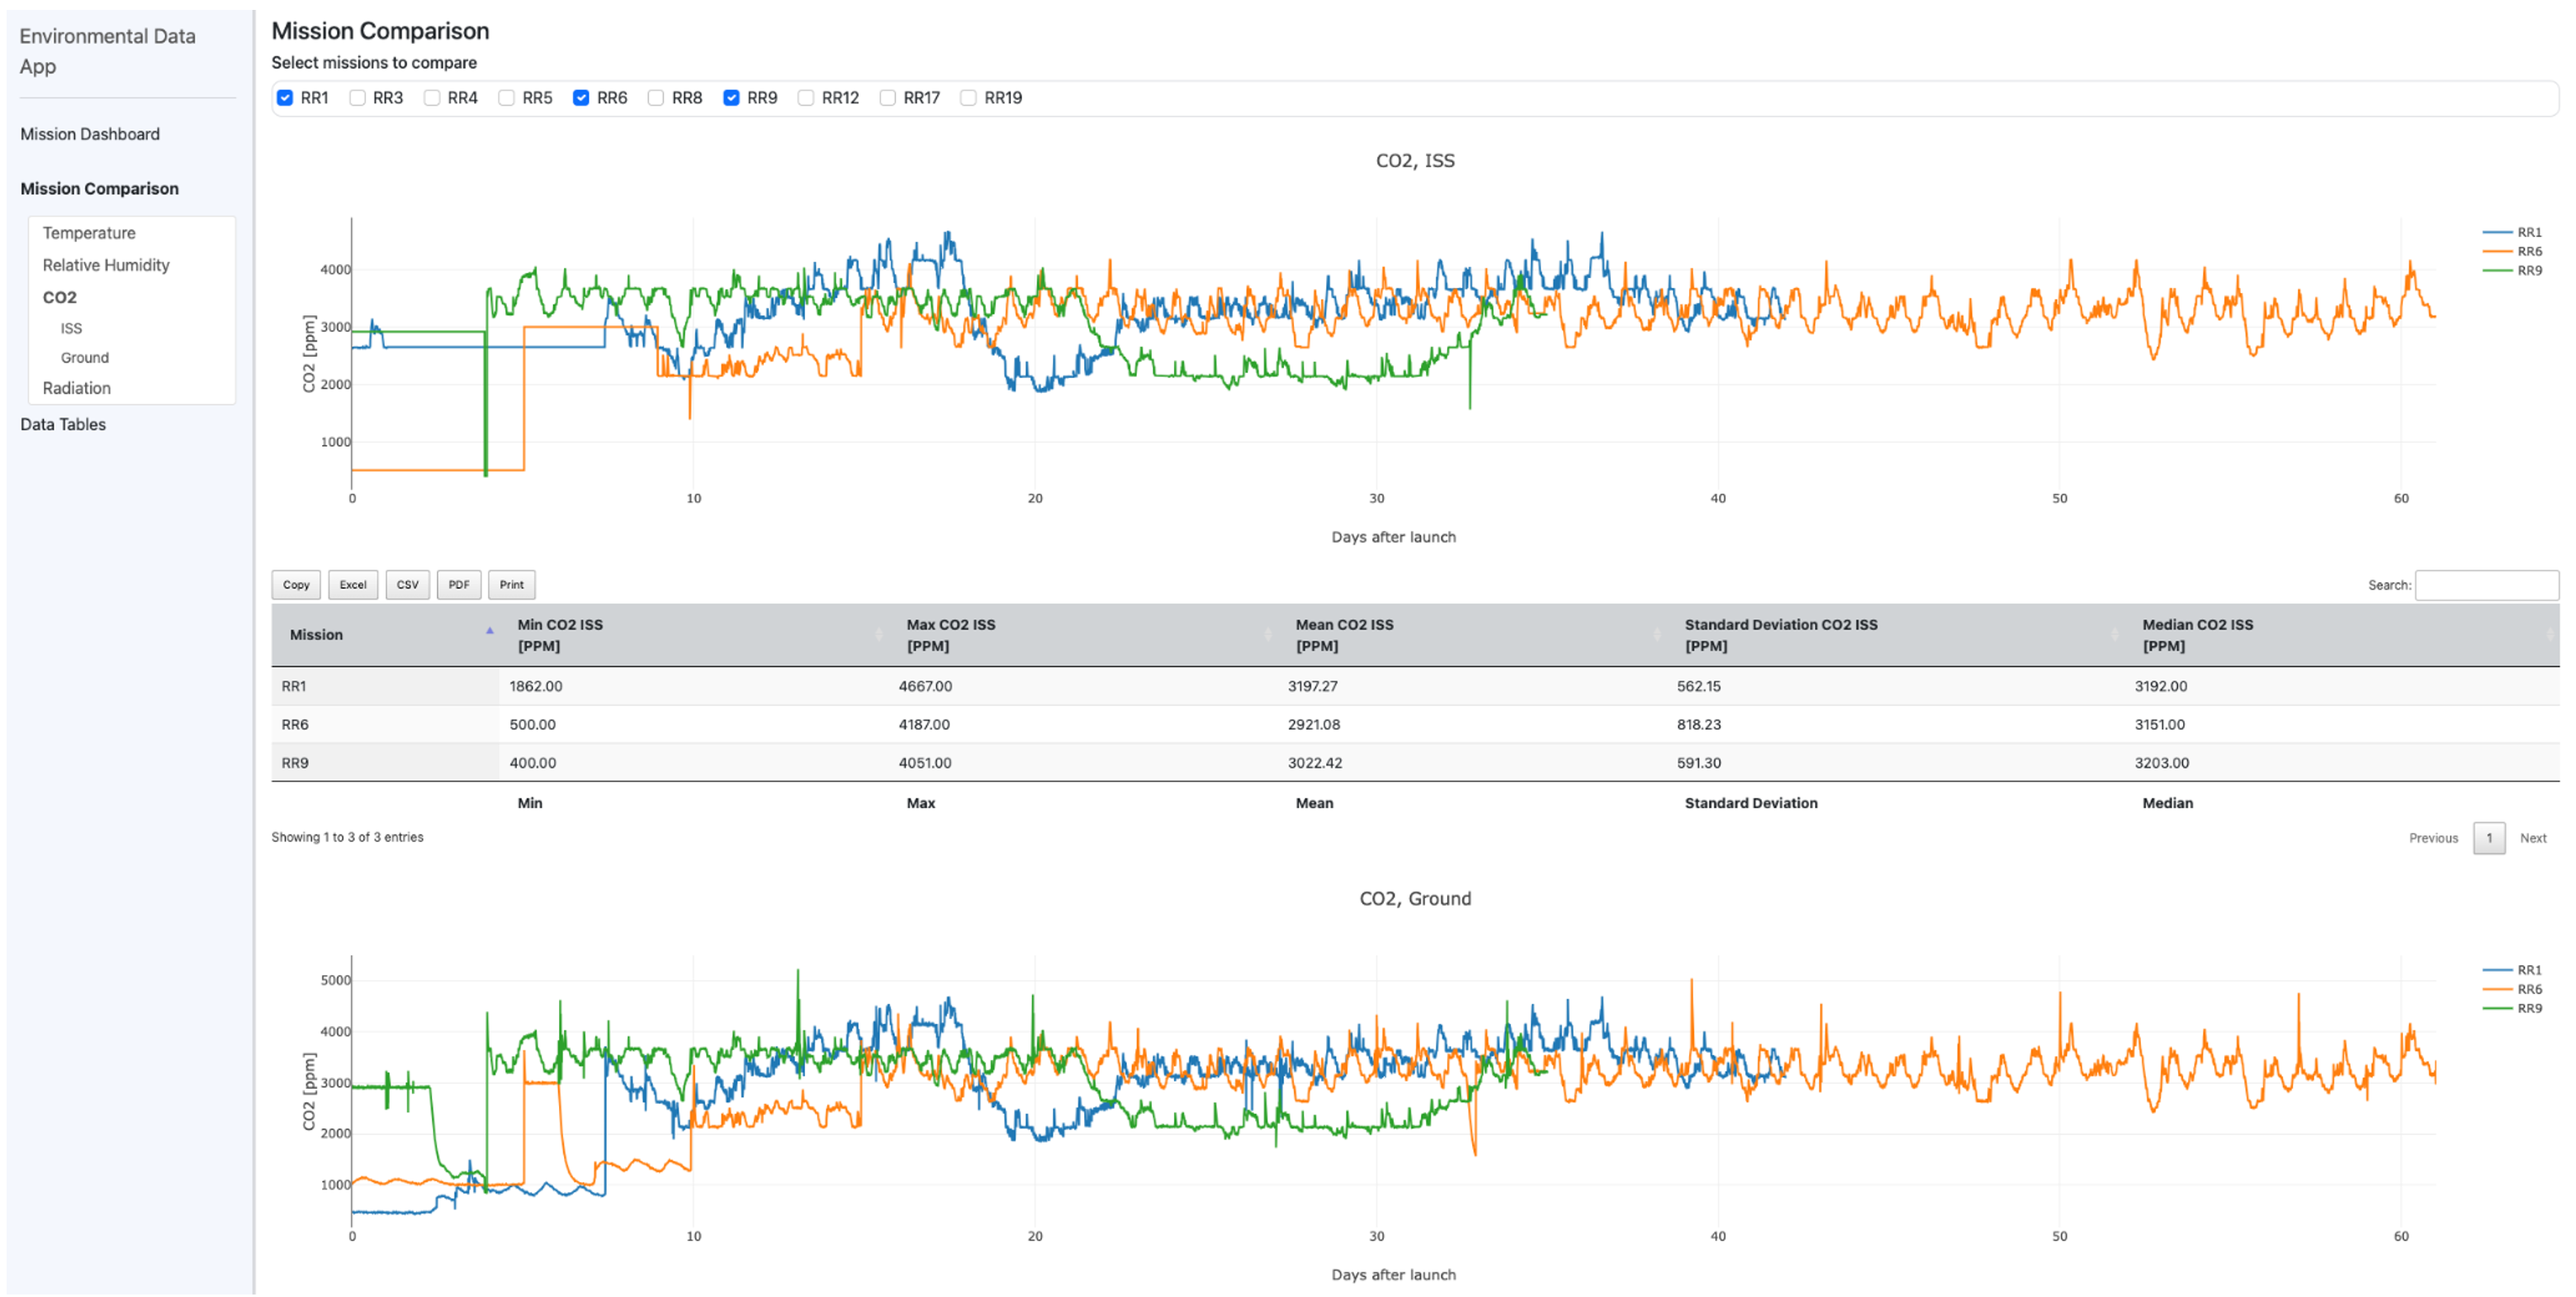
A screenshot showing a line graph comprising of atmospheric CO2 data collected during RR1, RR9 and RR9. One graph displays the data from the ISS and the other displays the data from the “Ground” controls. There is a table below that allows the user download the raw data in a variety of different formats including .CSV, .PDF, .excel, Copy or Print.
Tables of environmental meta-data with download option.
The environmental data app allows users to access the underlying data tables for export.
The user can copy the data for pasting into reports or spreadsheets or download all the raw data in .CSV, .PDF, excel, or send it directly to “Print”.
In this example, the screenshot has been adjusted so all 3 tables. The table is the summary data, the second is the telemetry data and the third is the radiation data.
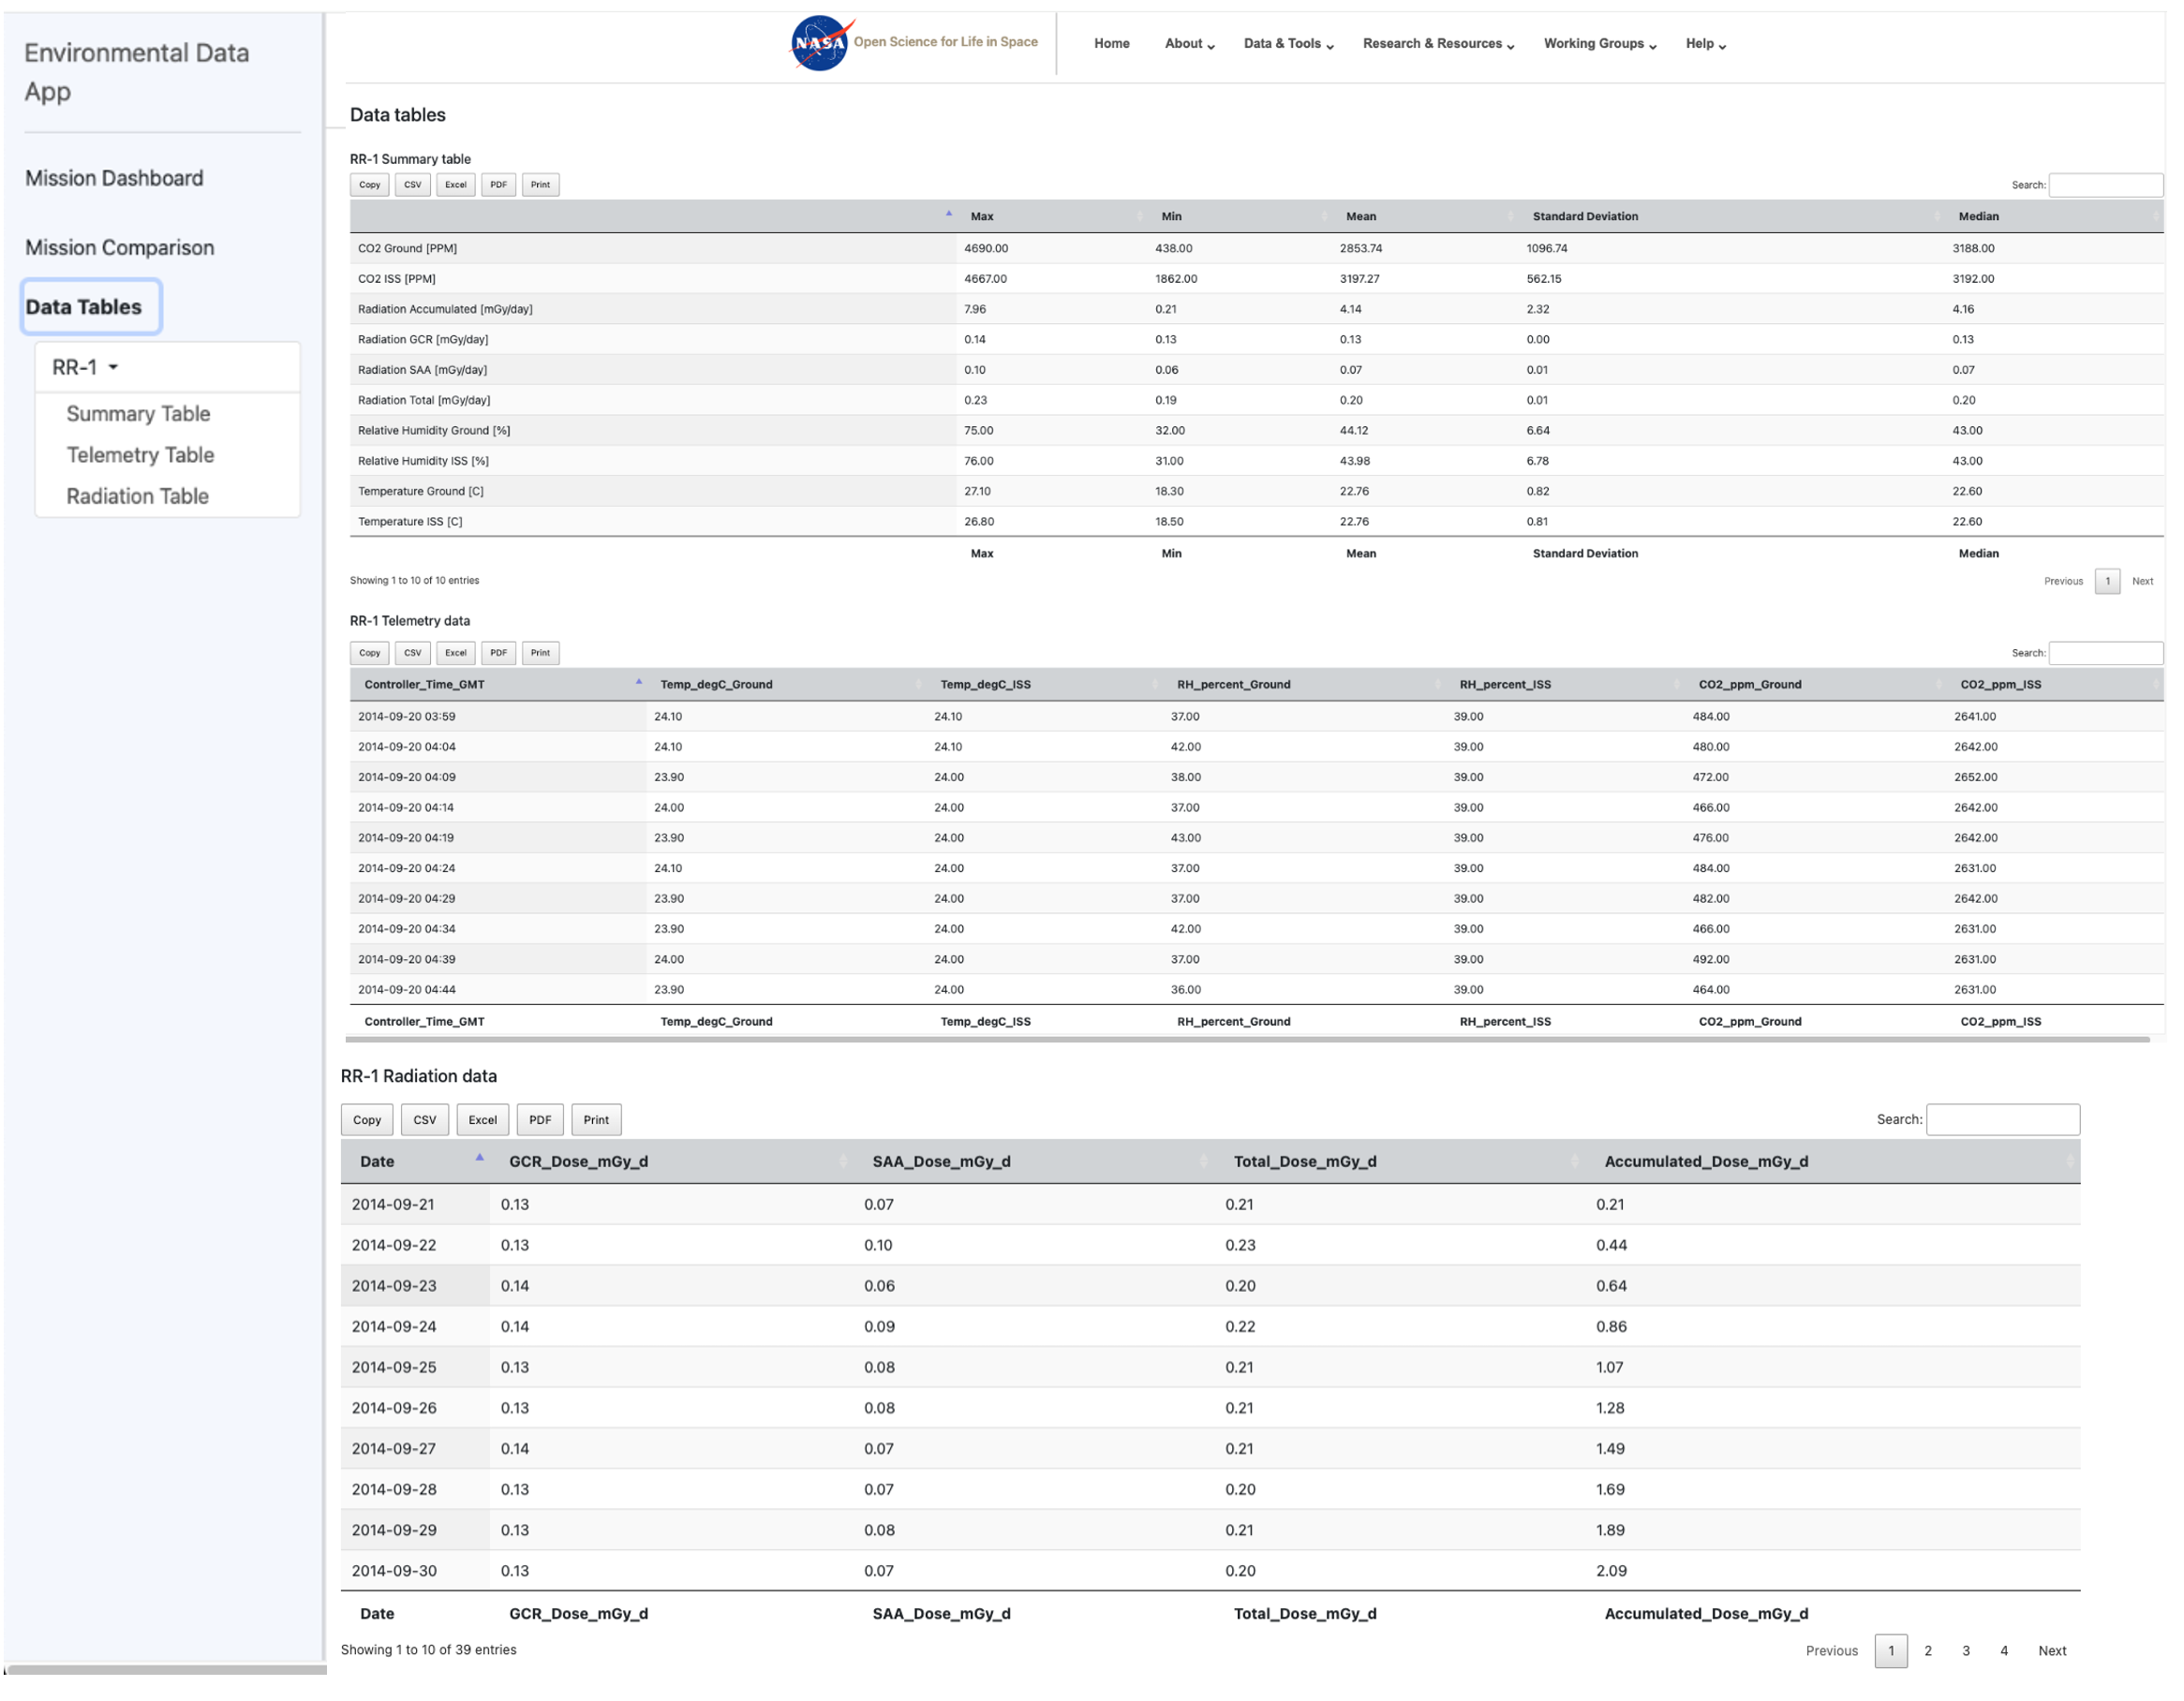
Screen showing 3 data tables that can be accessed for downloading and further analysis. The first table shows the “Summary table of data”, the second contains the “Telemetry data” and the third contains the radiation data.
Radiation meta-data come from many different sources
These data include environmental data from the space vehicles or payloads (hardware). Currently, OSDR has gathered radiation dosimetry data from spaceflight experiments and provides a complete table for several spacecraft under the ‘Environmental Data’ menu option.
Select an option from the left menu to display the environmental data available for OSDR studies from that spacecraft dosimetry.
Shenzhou-8 example: selecting Shenzhou-8 Radiation Dosimetry in the environmental data menu opened a hyperlink that provides a list of all associated samples that are in the OSDR and both quantitative and quality metadata descriptions that provide important context.
.png)
The table displays data related to radiation dosage for the Shenzhou 8 mission. It lists all the samples in the OSDR and their specific ID number.
In addition, users can find radiation dosimetry details per sample within the sample table for available space flown OSDR study. To access this data, click on the desired OSDR number on the table and navigate to the Samples tab.
Example: Radiation metadata for OSDR dataset OSD-63 through the samples tab.
.png)
Some of the radiation metadata has been linked to the sample metadata table link it to the Source Name, Sample Name, Exposure Duration, Absorbed Radiation and Maximum Total Absorbed Dose.