
Gene-metabolite decoupling & SOD isoform divergence
Sweet basil (Ocimum basilicum) exposed continuously for 4 weeks to near-null magnetic fields (<40 nT vs GMF ~44.4 µT): essential oils and flavonoids rise while their biosynthetic transcripts fall, and superoxide dismutase isoforms split in opposite directions.
Source: Mannino, Caldo & Maffei (2026), Journal of Plant Physiology 326:154872, doi:10.1016/j.jplph.2026.154872, Ocimum basilicum.
- 21loci in the source table
- 4are QBO atlas loci
- 1timepoints × 1 tissues
- 21values parsed
These are the authors' published results, not a reanalysis. No raw data was deposited in any public repository. The article's Data Availability Statement reads, in full: “Data will be made available on request”
So nothing on this page can be recomputed, re-thresholded or re-tested from source
data. What is drawn is what the authors chose to report, read out of
gene_expression.tsv and re-projected onto the maps. That is a weaker
provenance than the NASA OSDR pages in this atlas, which rest on processed data anyone
can download, and it is labelled differently throughout:
published_results.
What was measured
near-null magnetic field (<40 nT) against the local geomagnetic field (~44.4 µT), generated in a triaxial Helmholtz coil system and monitored with a three-axis Bartington Mag-03 magnetometer. Values are Mannino's reported
fold change for hMF-grown plants relative to GMF-grown controls, as
mean ± SD.
Two findings that require structural representation:
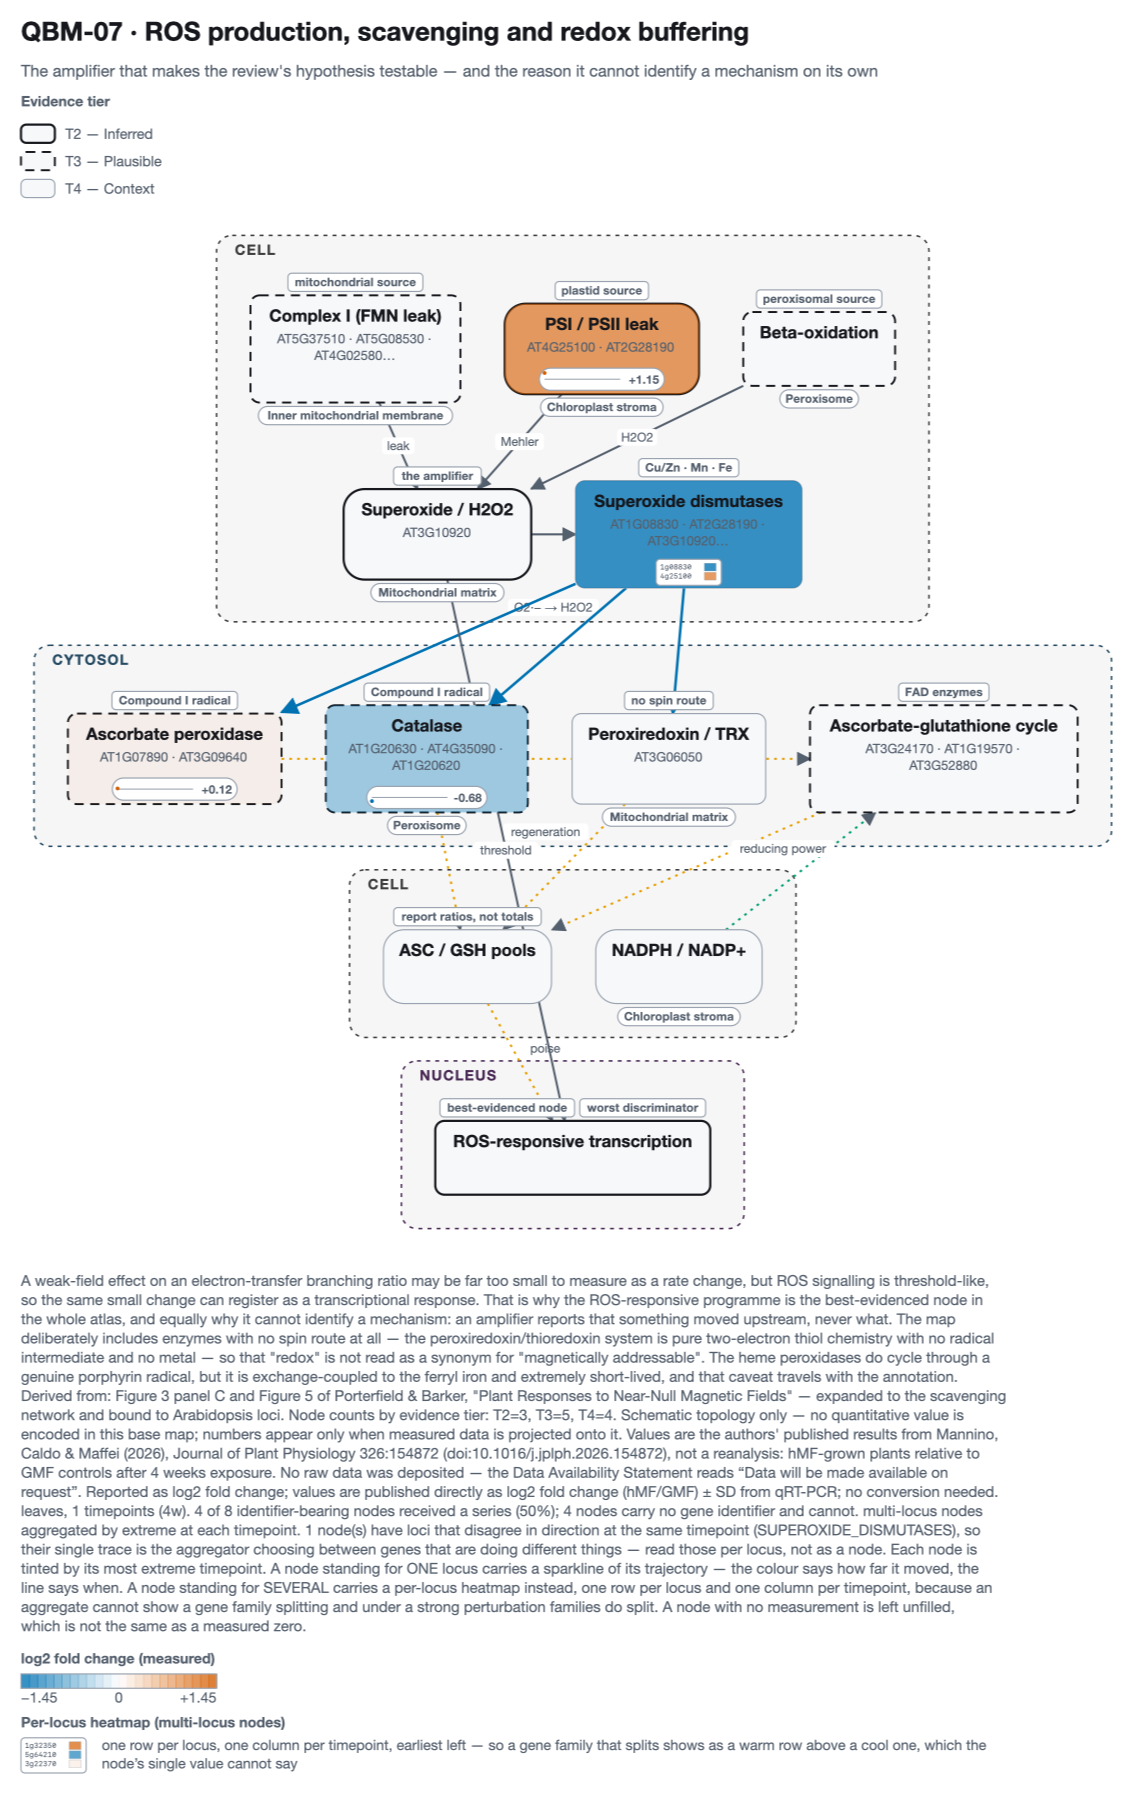
- 2-Row Heatmap on Superoxide Dismutases (Isoform Divergence): Under hMF, cytosolic/chloroplastic Cu/Zn-SOD (
ObCSD→AT1G08830) is strongly downregulated (log2FC =-1.45 ± 0.15, blue), whereas chloroplast Fe-SOD (ObFSD1→AT4G25100) is strongly upregulated (log2FC =+1.15 ± 0.12, vermillion). Averaging them into a single node value would yield-0.15— falsely reporting that superoxide dismutation did not respond. The 2-row heatmap preserves both isoforms side by side. - Gene-Metabolite Decoupling in Phenylpropanoid & Volatilome Biosynthesis: Essential oil volatiles (eugenol
+28%, methyl eugenol+79%, cis-ocimene+119%) and total flavonoids (+18%) increase significantly, yet every measured biosynthetic transcript (ObPAL,ObCOMT,ObEGS,ObEOMT,Ob4CL,ObCHS,ObCHI,ObCHIL) is significantly repressed (log2FC-0.70to-1.65).
Dedicated Sub-Map: Phenylpropanoid & Volatilome Gene-Metabolite Decoupling
In sweet basil under near-null magnetic fields (<40 nT), secondary metabolism decouples from steady-state transcript abundance: blue boxes show significant downregulation across all 8 phenylpropanoid and early flavonoid enzymes, while vermillion boxes show significant physical accumulation of their volatile and flavonoid end-products.
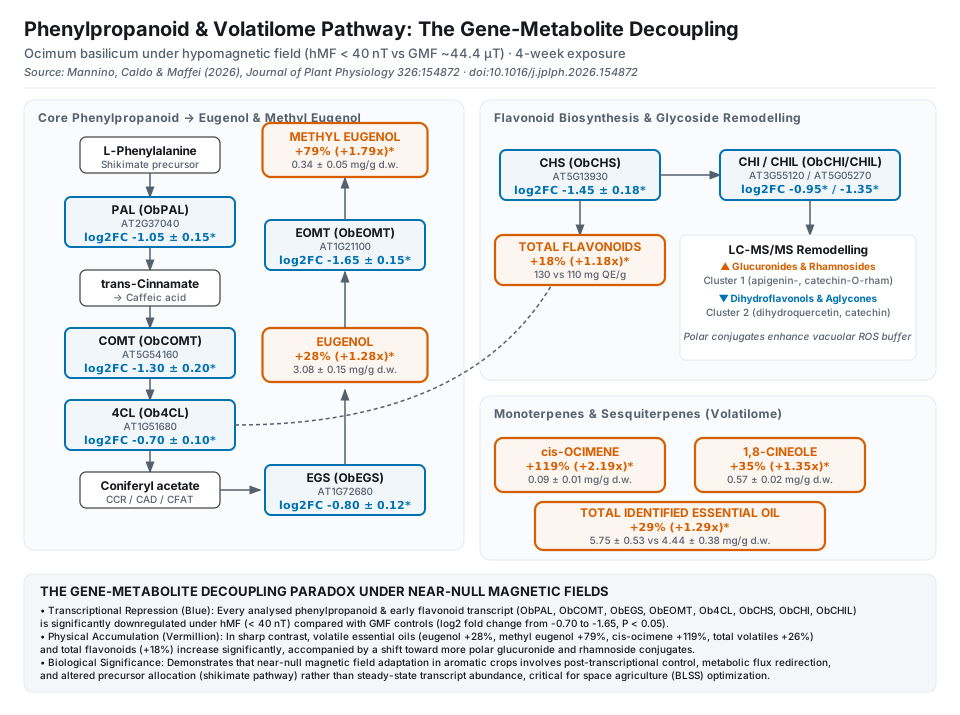
Decoupling of transcript abundance and metabolite accumulation. Blue enzyme boxes carry qRT-PCR log2 fold changes (hMF/GMF ± SD, all P < 0.05); vermillion metabolite boxes carry GC-FID/GC-MS absolute accumulation fold changes and concentrations (mg g⁻¹ dry weight ± SD, P < 0.05).
The QBO pathway maps
Each node is tinted by its extreme value; multi-locus nodes where isoforms diverge in sign (such as SUPEROXIDE_DISMUTASES displaying ObCSD vs ObFSD1) render a 2-row heatmap directly inside the node box.

2-Row Heatmap (Isoform Divergence) on SUPEROXIDE_DISMUTASES: AT1G08830 (ObCSD, Cu/Zn-SOD) is downregulated (-1.45, blue) while AT4G25100 (ObFSD1, Fe-SOD) is upregulated (+1.15, vermillion).
Values are the authors' published results from Mannino, Caldo & Maffei (2026), Journal of Plant Physiology 326:154872 (doi:10.1016/j.jplph.2026.154872), not a reanalysis: hMF-grown plants relative to GMF controls after 4 weeks exposure. No raw data was deposited — the Data Availability Statement reads “Data will be made available on request”. Reported as log2 fold change; values are published directly as log2 fold change (hMF/GMF) ± SD from qRT-PCR; no conversion needed. leaves, 1 timepoints (4w). 4 of 8 identifier-bearing nodes received a series (50%); 4 nodes carry no gene identifier and cannot. multi-locus nodes aggregated by extreme at each timepoint. 1 node(s) have loci that disagree in direction at the same timepoint (SUPEROXIDE_DISMUTASES), so their single trace is the aggregator choosing between genes that are doing different things — read those per locus, not as a node.
Every value behind the figures
The numbers on the maps, in full, so the figures can be checked rather than taken on trust. Values are log2 fold change (hMF vs GMF); multi-locus nodes display their 2-row per-locus heatmap.
QBM-07 · Leaves
| Node | Tier | Loci | Trace / 2-Row Heatmap | 4w | Peak |
|---|---|---|---|---|---|
| PLASTID_ROS | T2 | AT4G25100 | +1.15 | +1.15 @ 4w | |
| SUPEROXIDE_DISMUTASES (isoforms diverge: 2-row heatmap) | T4 | AT1G08830 AT4G25100 | -1.45 | -1.45 @ 4w | |
| ASCORBATE_PEROXIDASE | T3 | AT1G07890 | +0.12 | +0.12 @ 4w | |
| CATALASE | T3 | AT1G20630 | -0.68 | -0.68 @ 4w |
Scroll the table sideways to see every timepoint.
What this does not show
- Coverage is partial by construction. The source table was filtered
by its authors to genes involved in oxidative reactions, so it reaches the redox map well
and the respiratory map barely. 4 of the atlas's QBO loci
appear in it:
AT1G07890, AT1G08830, AT1G20630, AT4G25100. - No significance is shown. The source reports
mean ± SDwith no per-gene adjusted p-value, so there is no threshold to mark and none is invented. The atlas's other overlays carry an asterisk for significance; this one deliberately has none. - A tier is not a result. The border style still reports how much is known about each node's field sensitivity, which is independent of how far it moved here. A T3 node that responds strongly is still a node with no measured magnetic mechanism.
- One experiment. Replication across the near-null-field literature is what the atlas's pre-registered test addresses, and that test's result was null with a minimum detectable effect of 4.0 — this page does not change that.
Reproducing it
PYTHONPATH=src python3 scripts/build_paper_showcase.py --paper Mannino2026
PYTHONPATH=src python3 scripts/build_paper_page.py --paper Mannino2026
The supplementary archive is fetched from EuropePMC and cached under
data/external/papers/; the parsed values, per-node series and coverage are
written to results/papers/Mannino2026/record.json,
and this page is generated from that record.