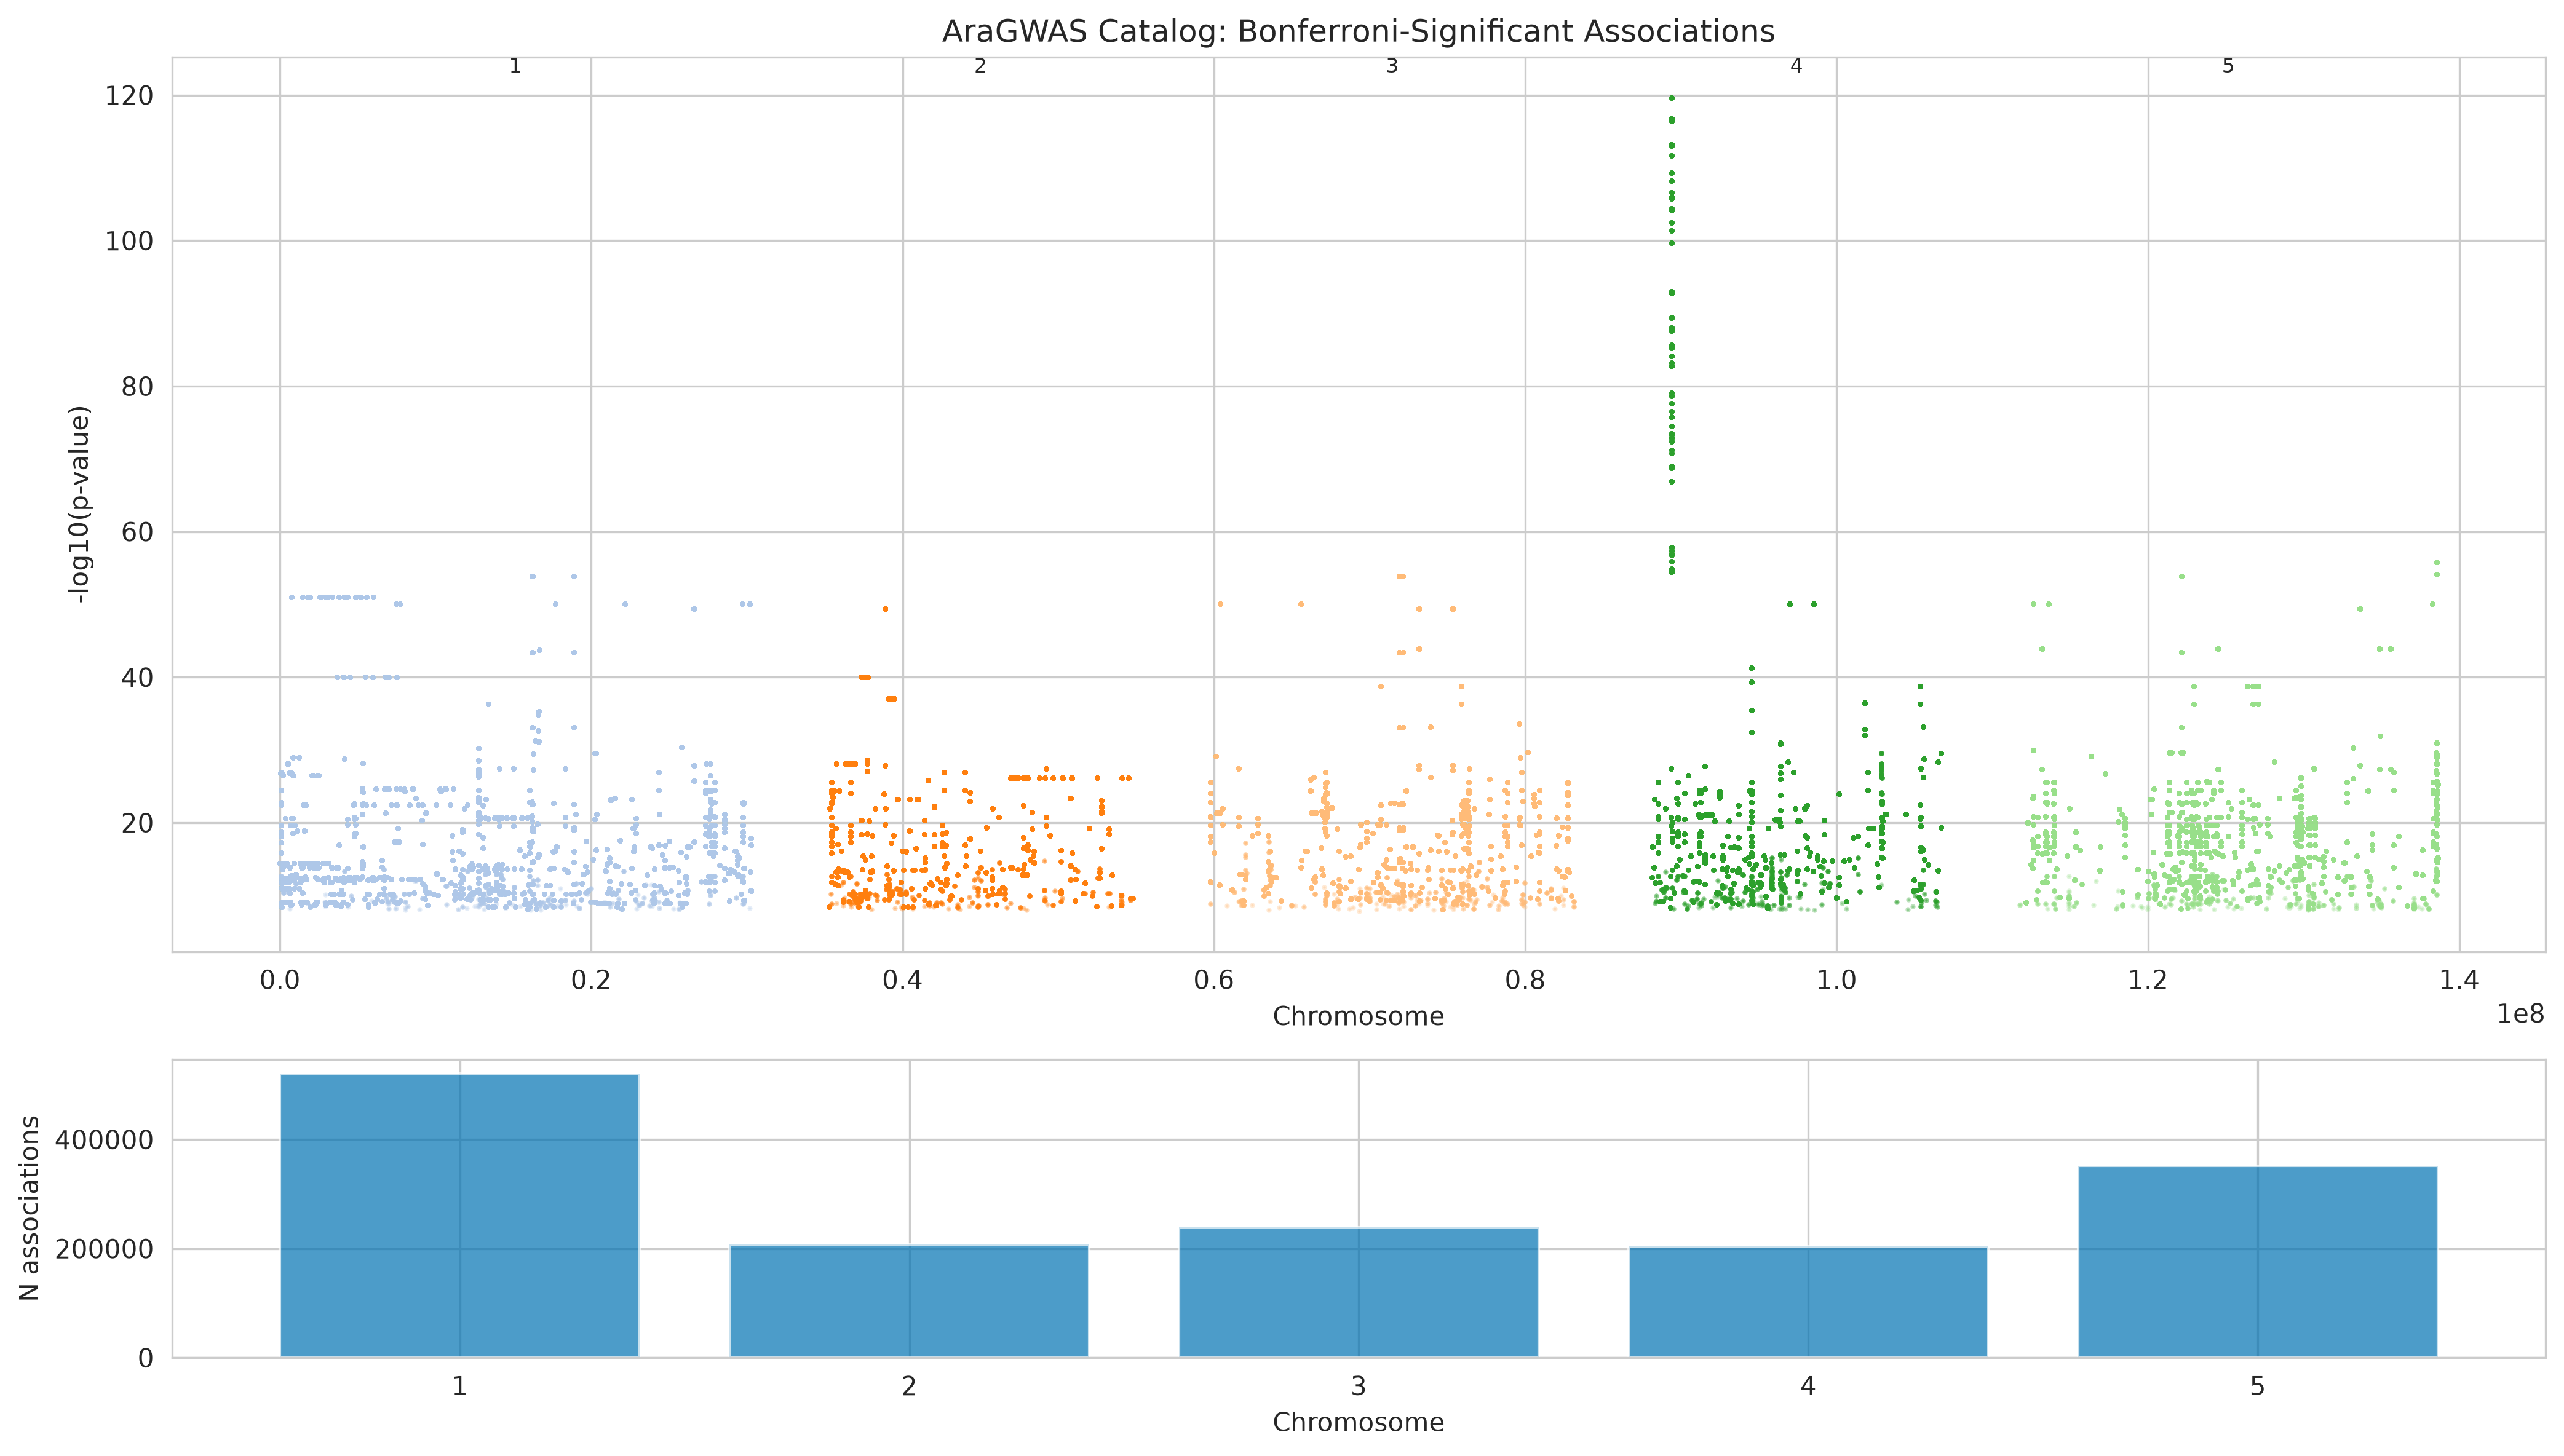
Figure 1: AraGWAS Catalog Overview
Manhattan plot displaying 1,523,262 Bonferroni-significant SNP-trait associations across 285 GWAS studies and 279 phenotypes in Arabidopsis thaliana.
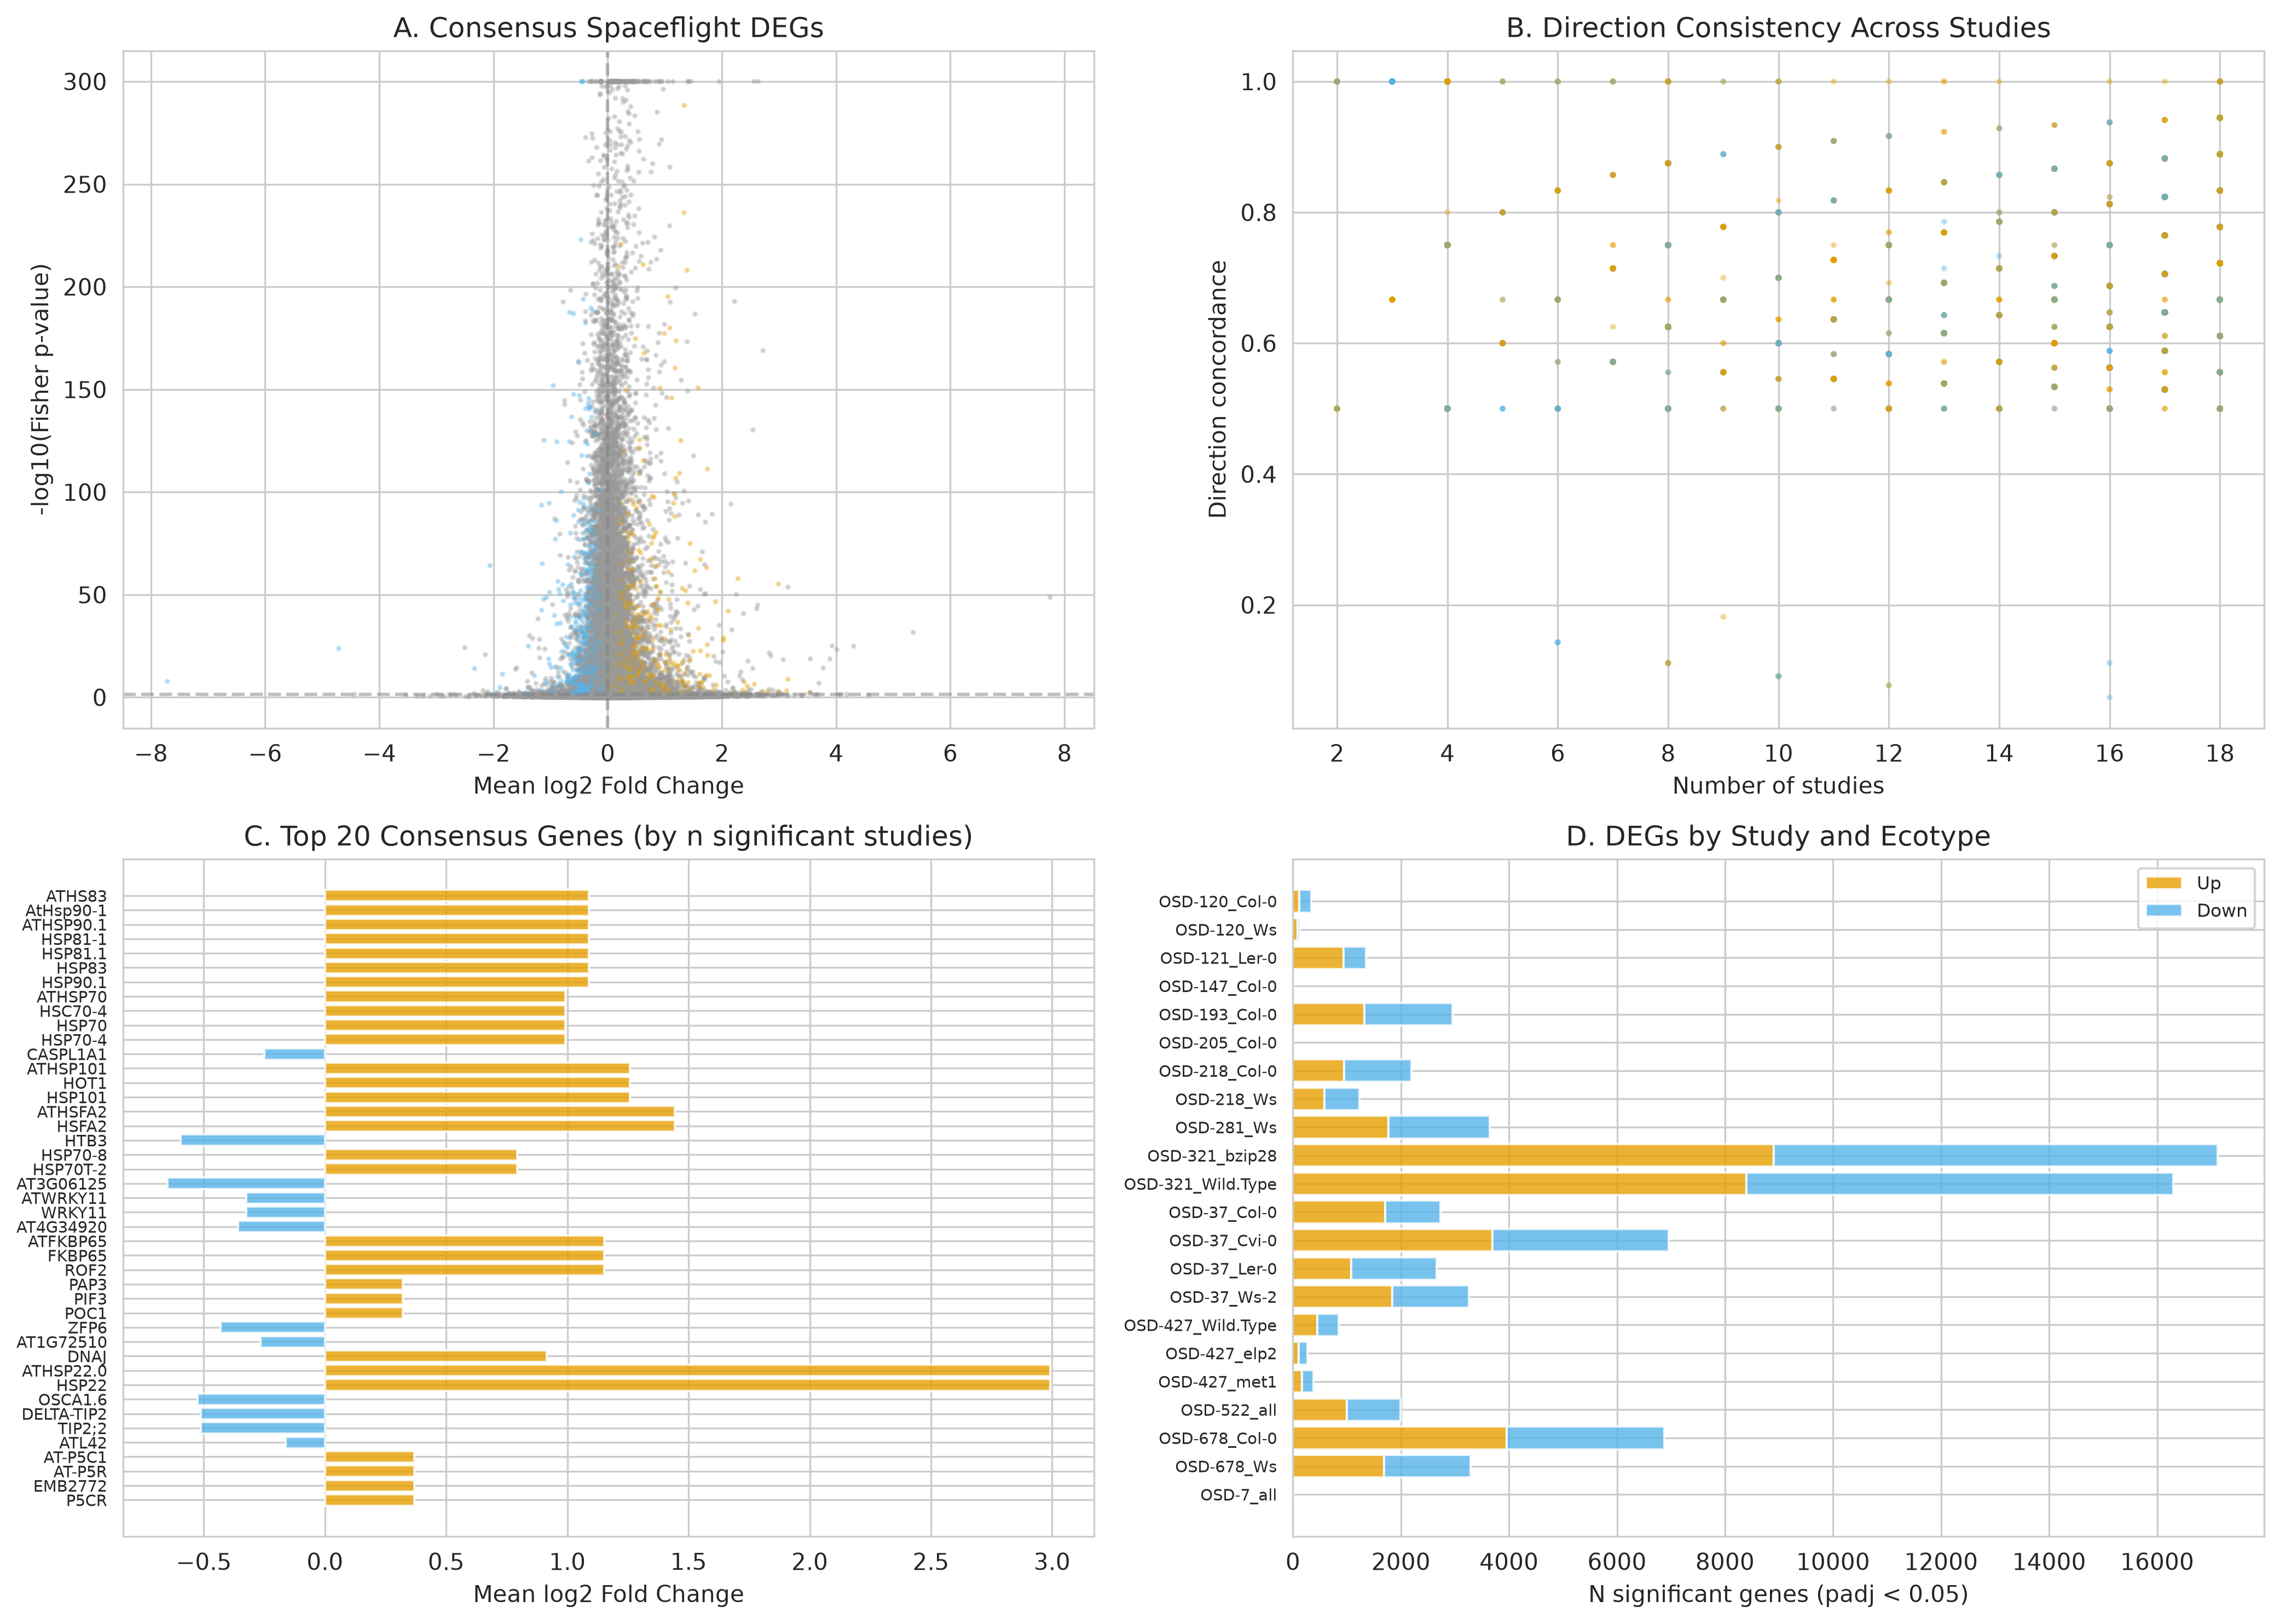
Figure 2: Spaceflight Transcriptomic Meta-Analysis & GO Enrichment
Cross-study volcano plot and top enriched GO Biological Process categories across 13 NASA GeneLab spaceflight studies (22 comparisons; 2,550 consensus DEGs).
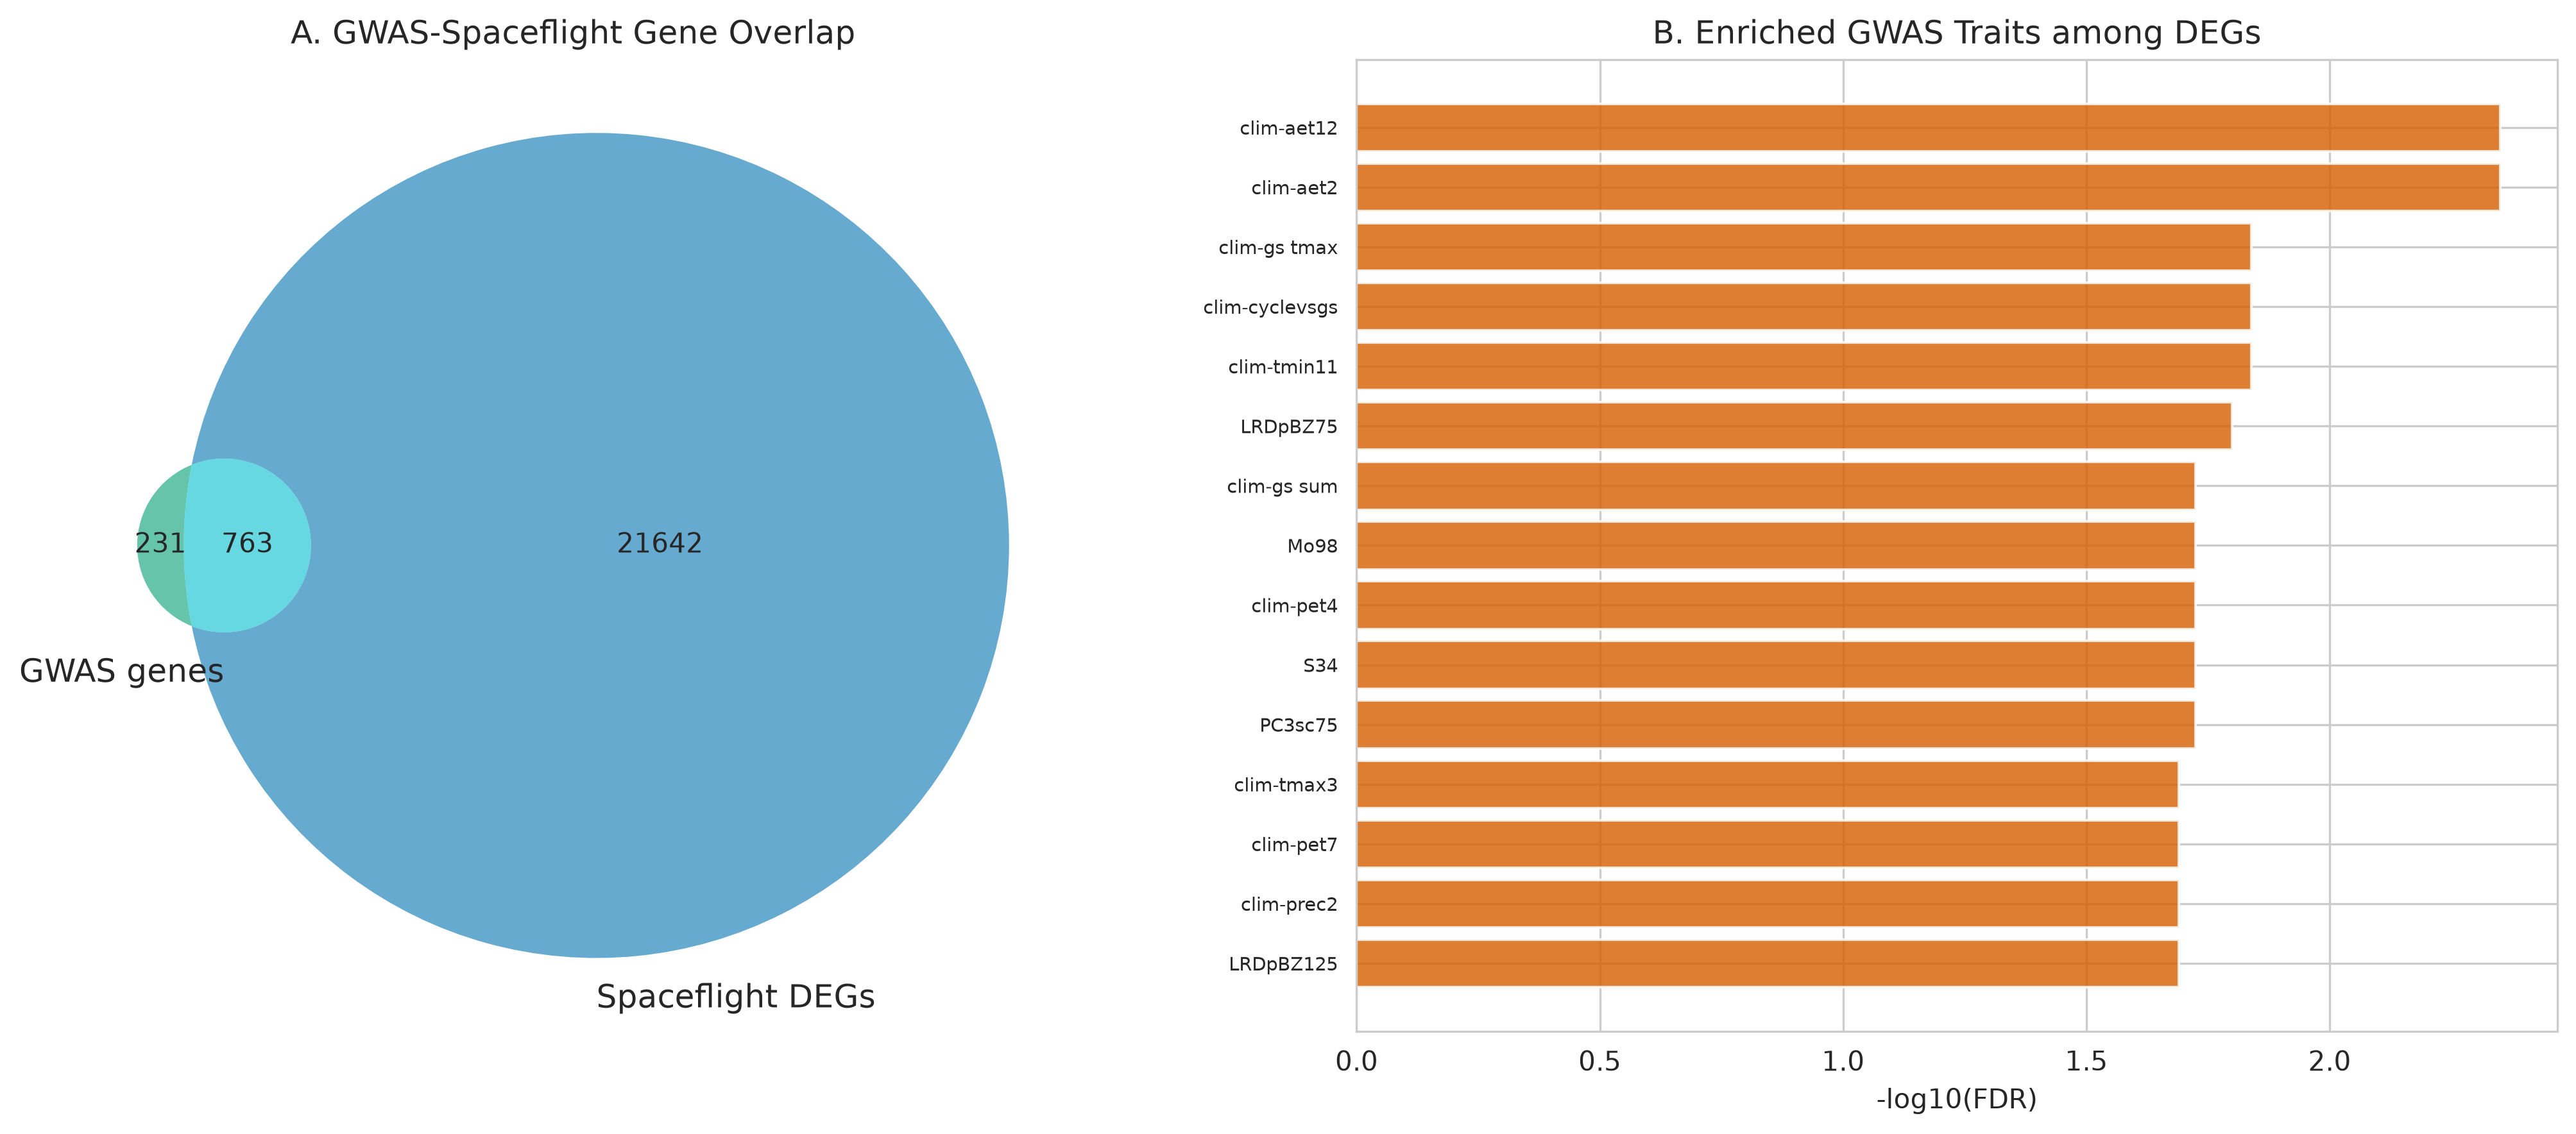
Figure 3: GWAS-Spaceflight DEG Integration
Over-representation analysis showing 763 overlap genes between GWAS candidates and spaceflight DEGs (Odds Ratio = 4.23, p = 4.45e-102).
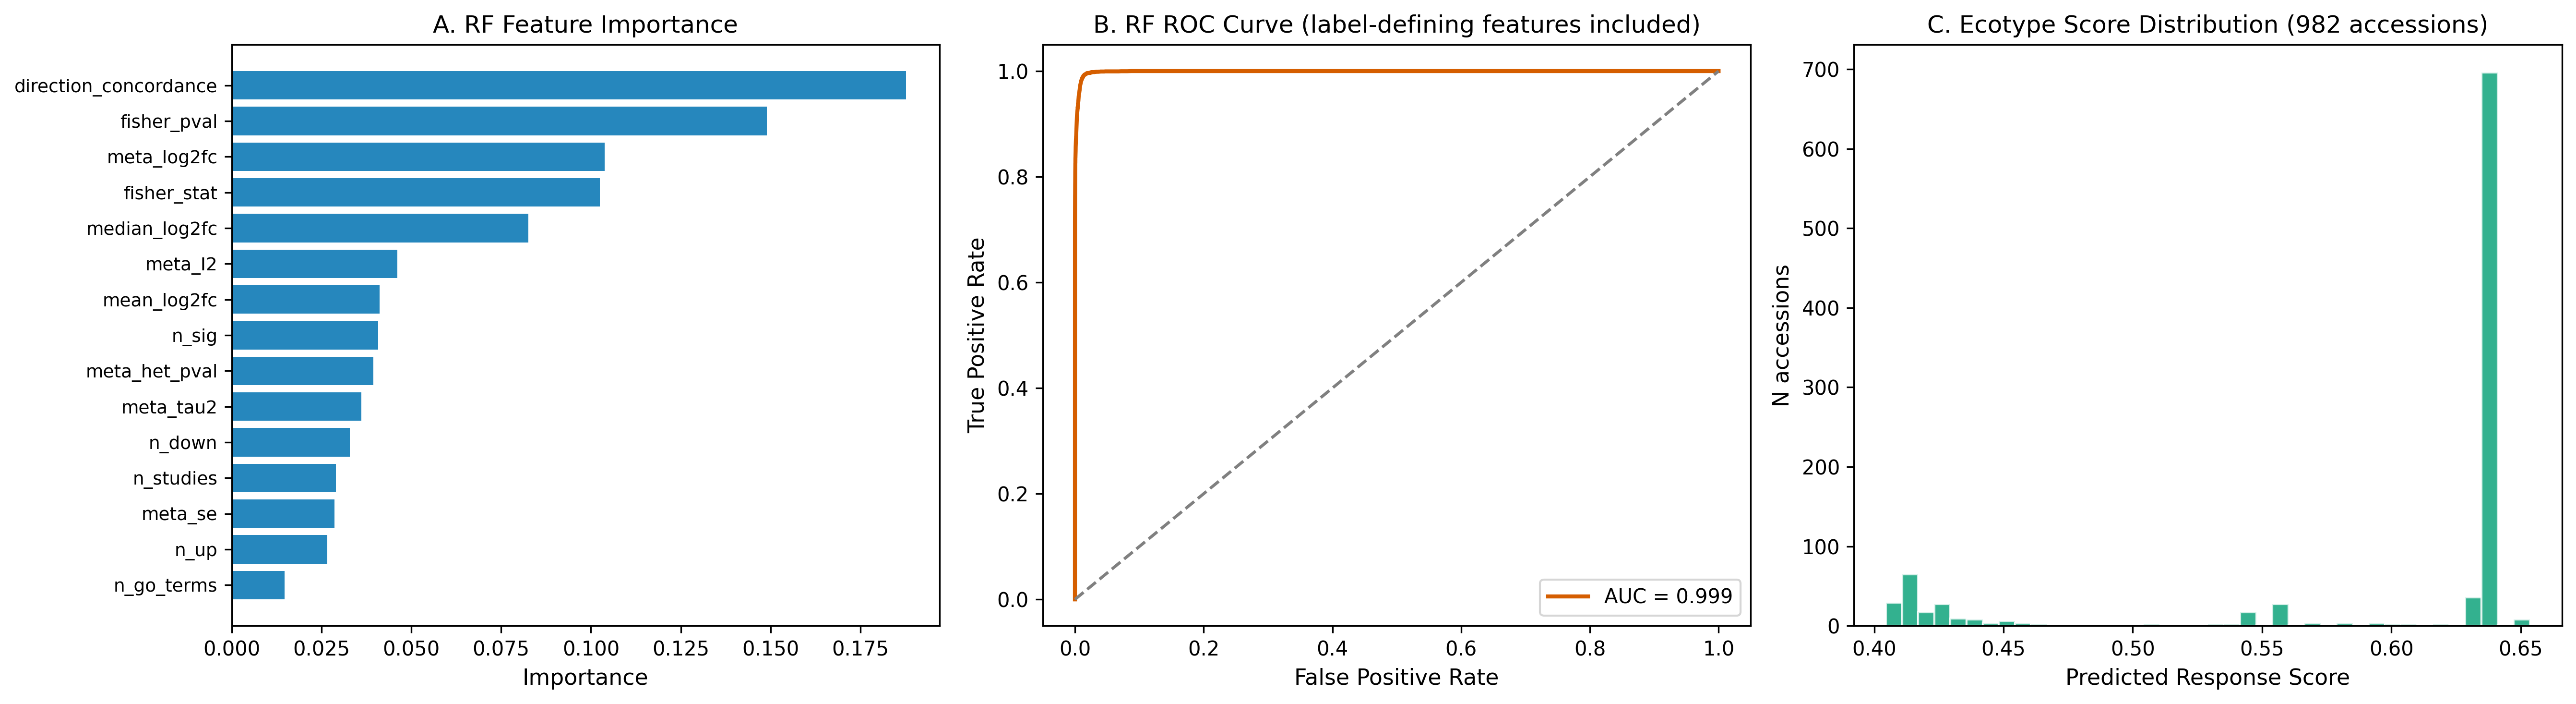
Figure 4: Machine Learning Classifier Performance
(A) Random forest feature importances and (B) ROC curve (AUC = 0.999), both recomputed from the committed classifier tables. The features include the Fisher and meta-analysis statistics that define the consensus label, so the AUC reflects recovery of the labelling rule, not independent predictive performance. (C) Distribution of the 982 predicted ecotype scores; 694 accessions share the same score (0.641). Script: code/29_fig4_ml_results.py.
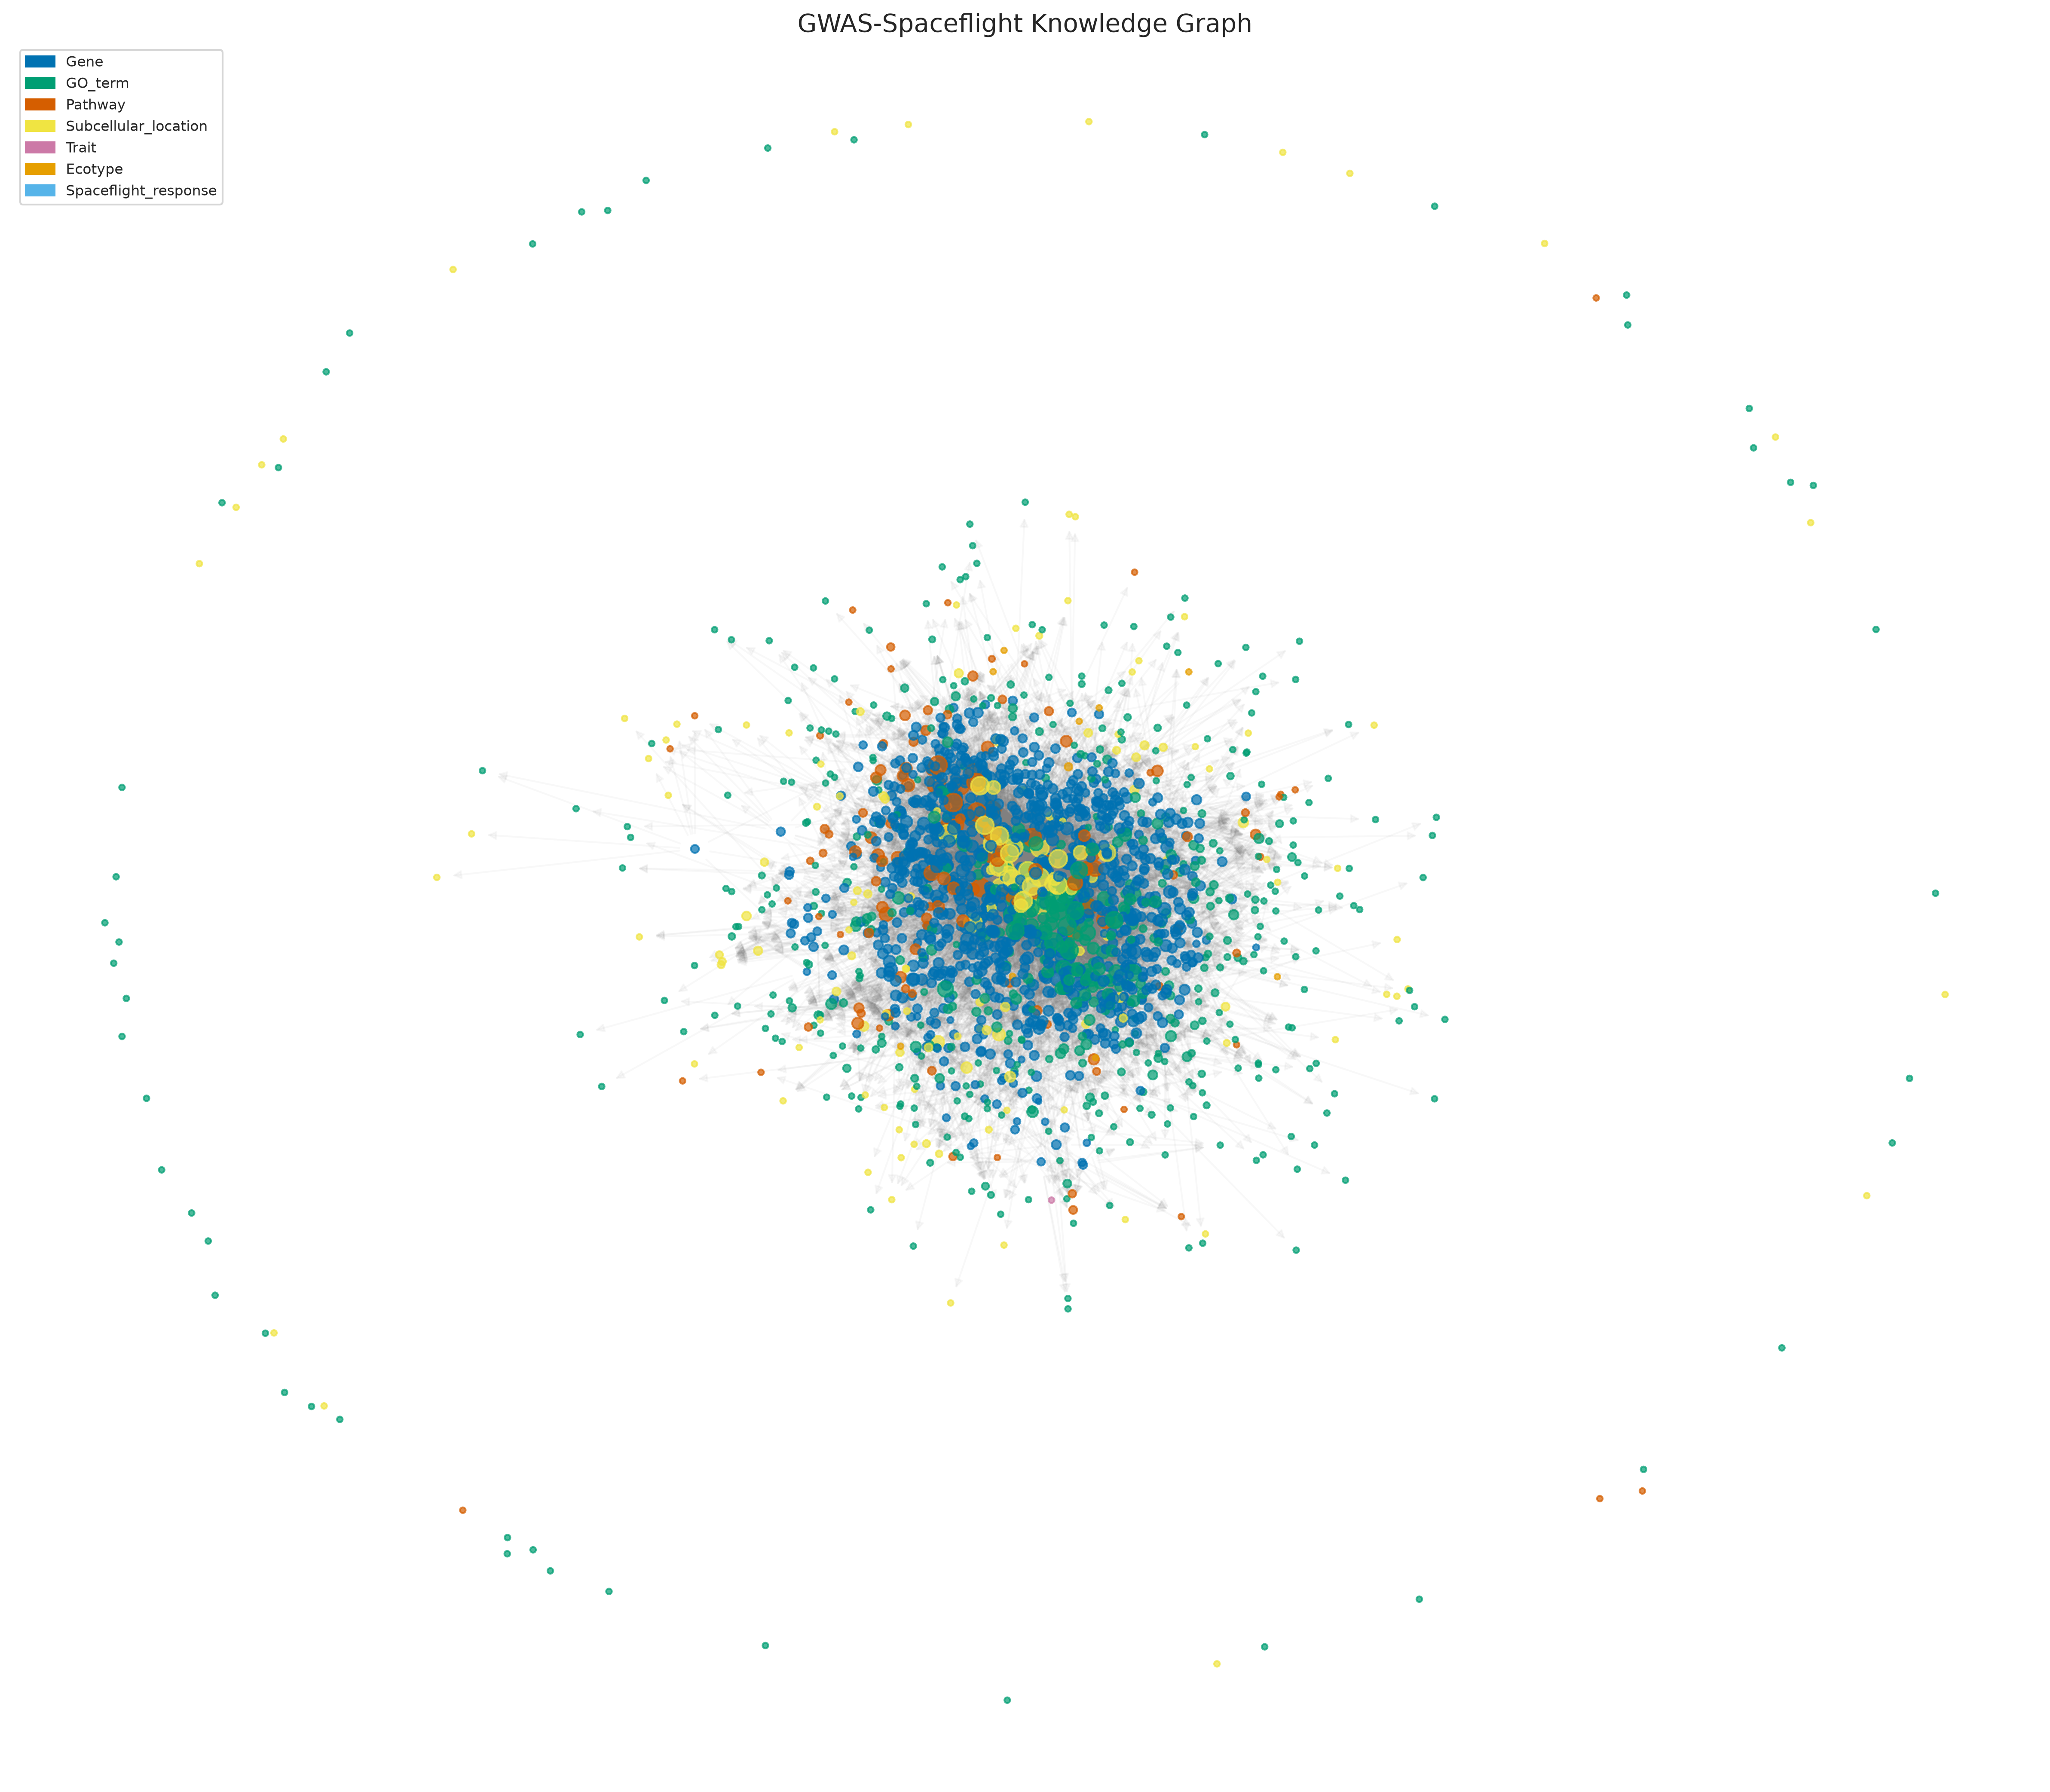
Figure 5: Multi-Layered Knowledge Graph Architecture
Network graph (24,565 nodes, 92,904 edges) interconnecting GWAS loci, DEGs, GO terms, KEGG pathways, subcellular localizations, and ecotypes.
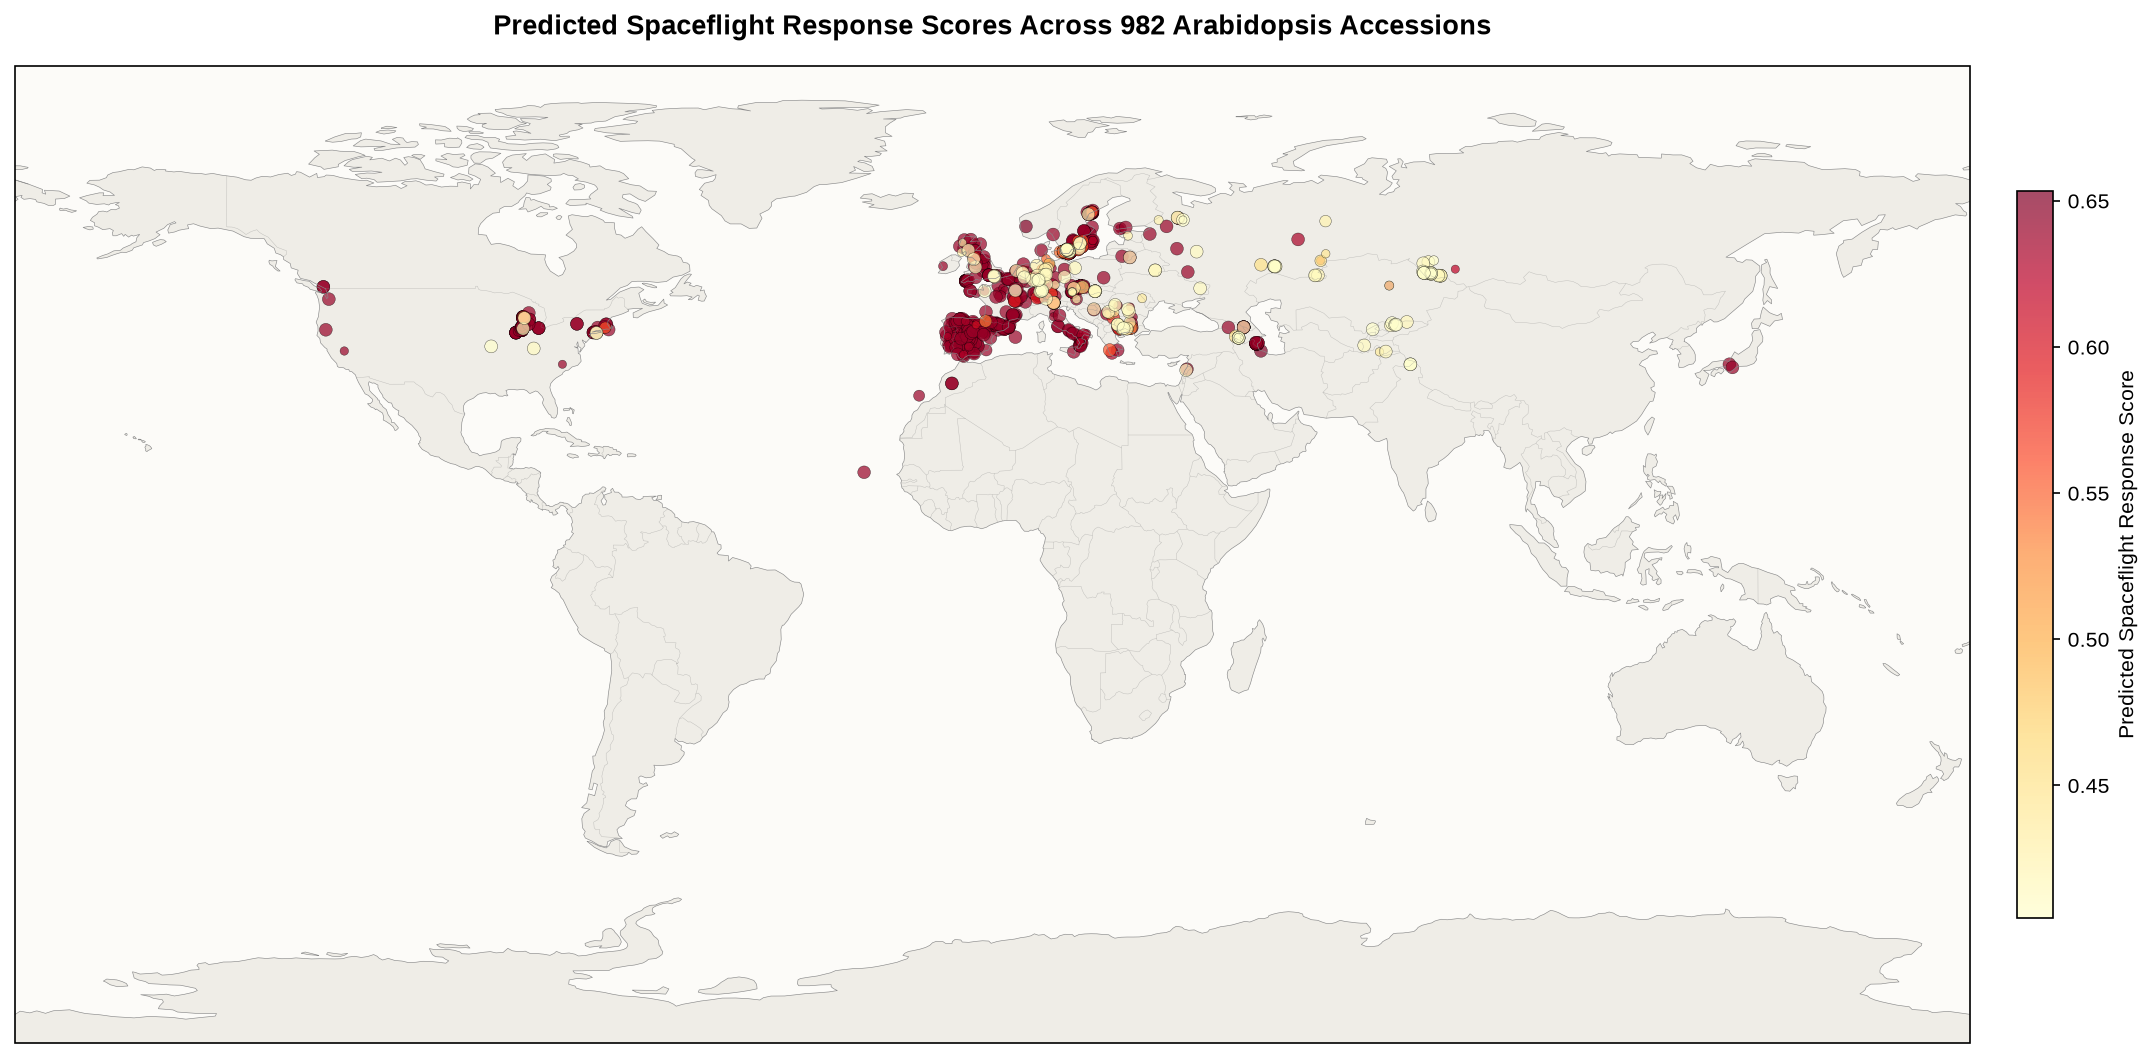
Figure 14: World Map of the 982 Scored Accessions
Global map of 982 1001 Genomes accessions scored at the 31 highest-scoring AraGWAS SNPs, with Open-Meteo elevation data.
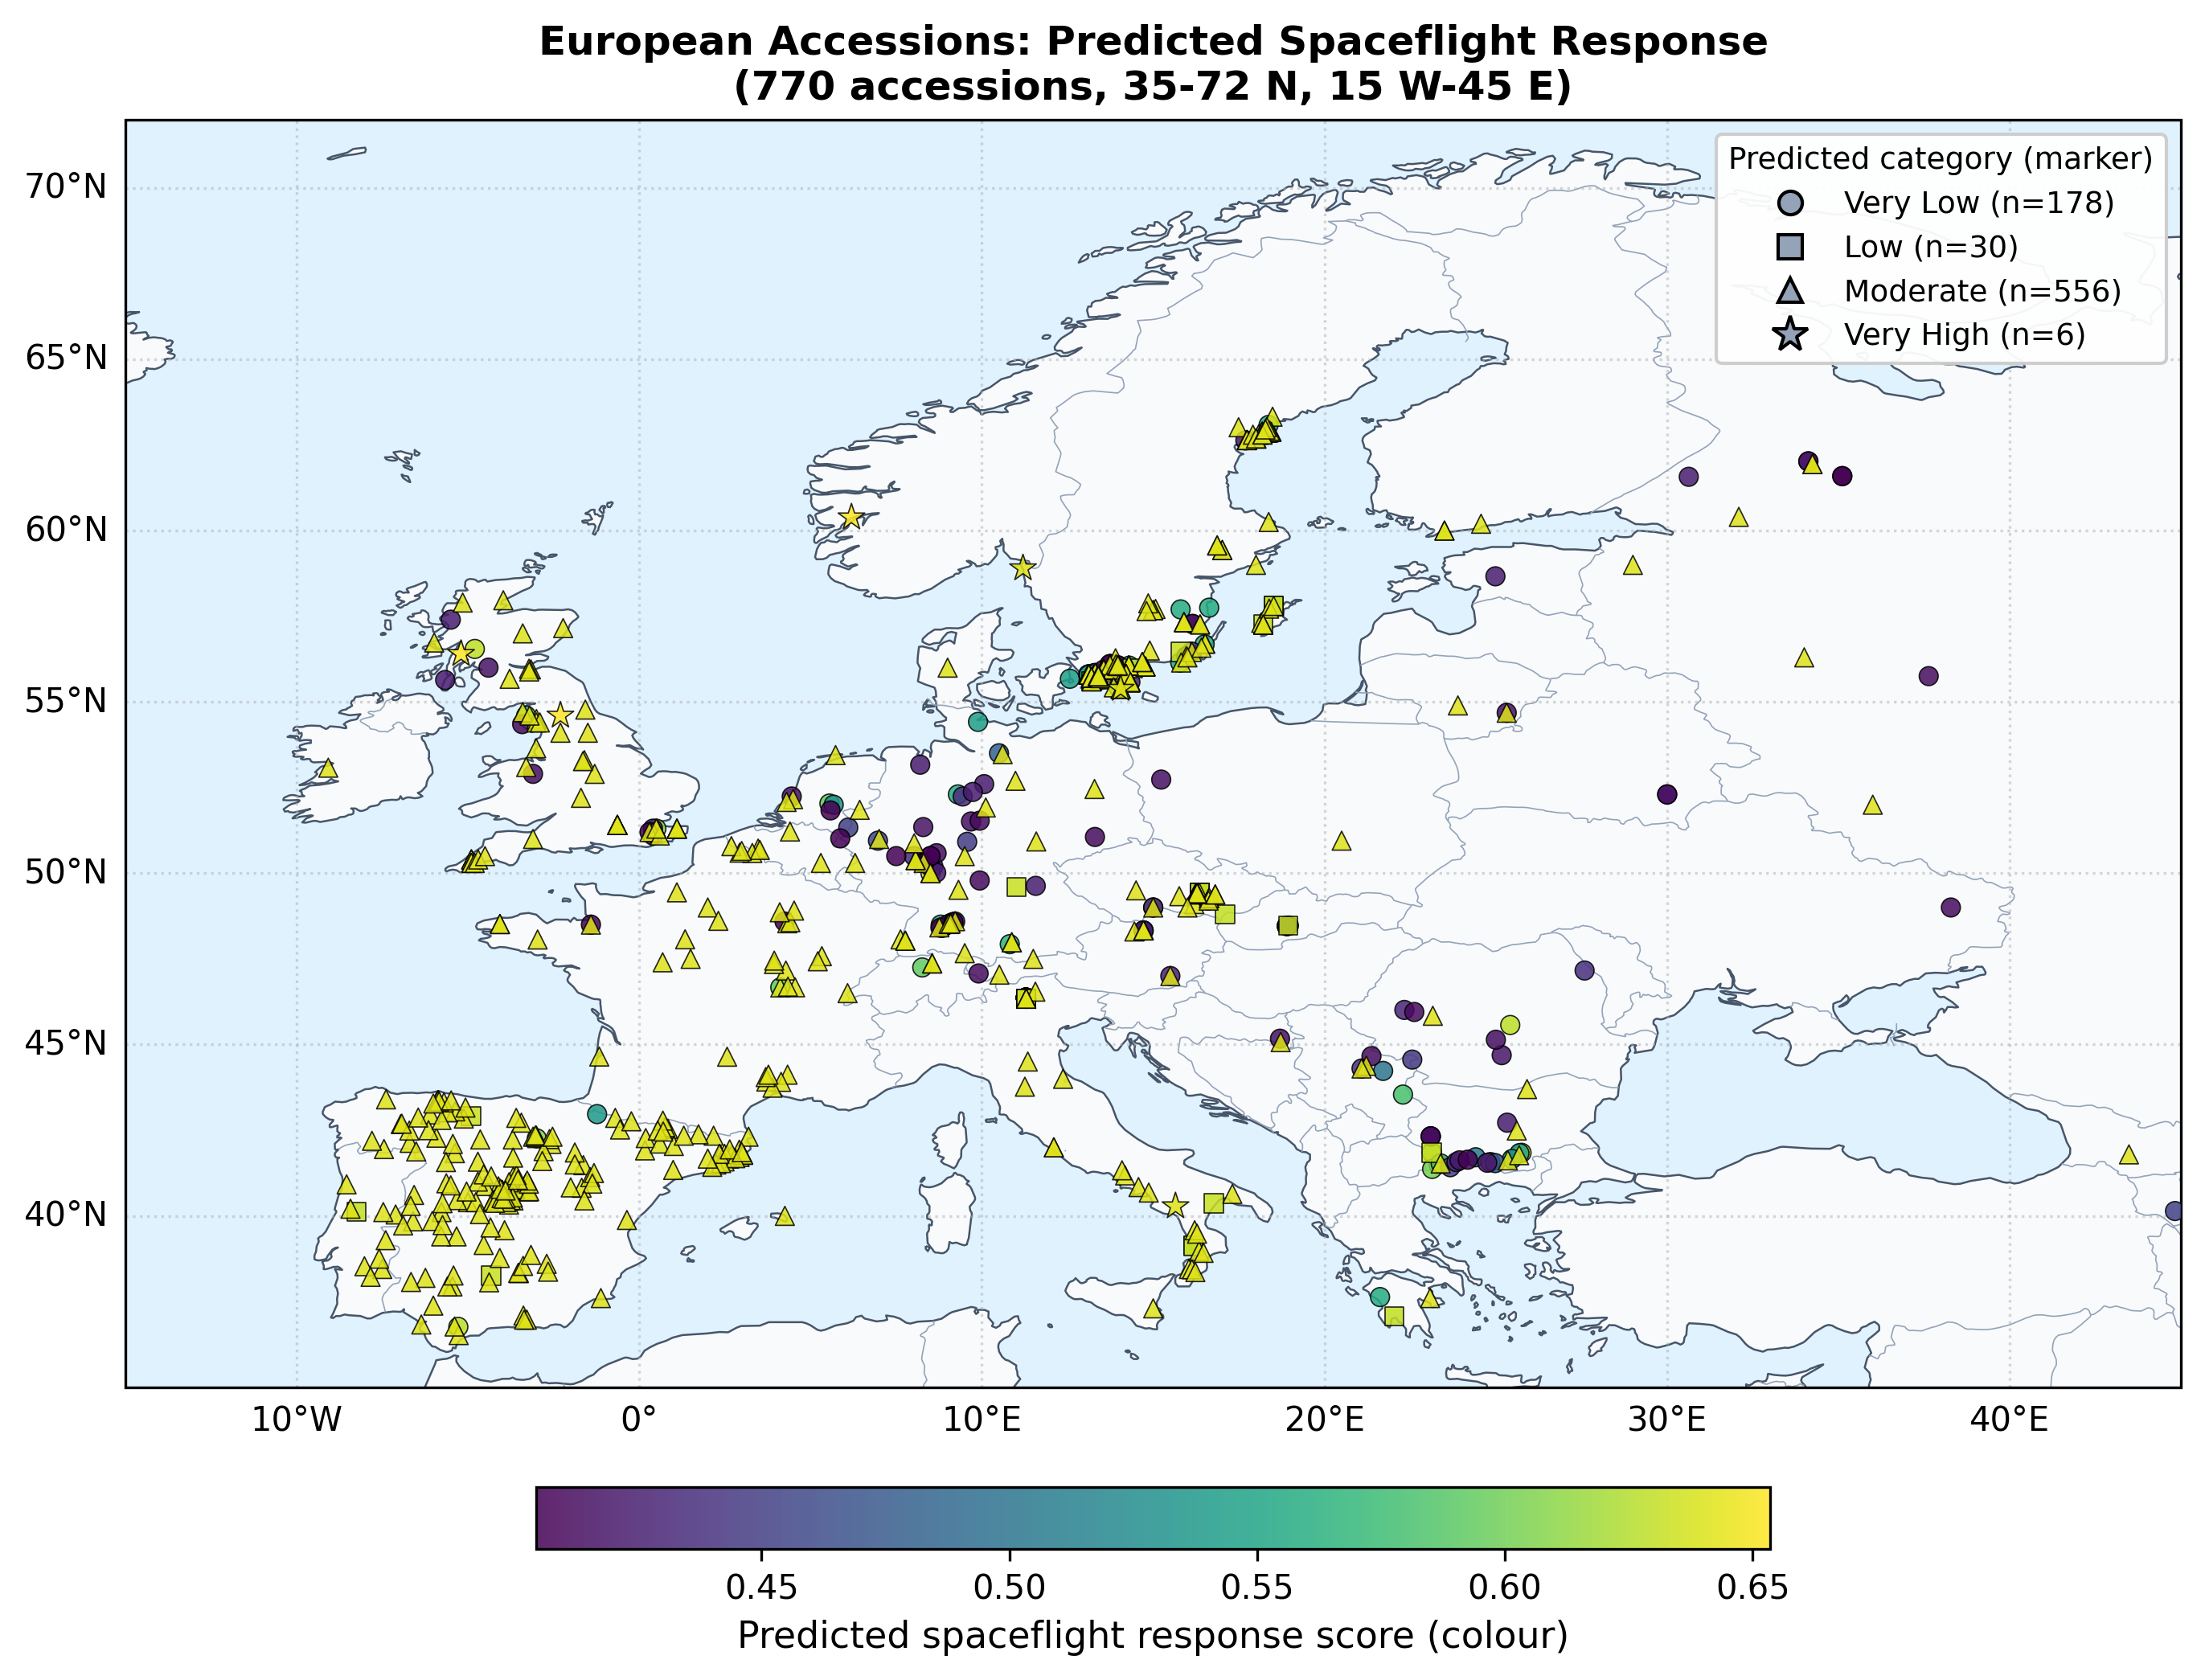
Figure 15: European Latitudinal & Altitudinal Sampling Density
The 770 accessions in the European box (35–72°N, 15°W–45°E): marker shape shows the predicted category, colour the predicted score. Script: code/33_fig15_europe_map.py.
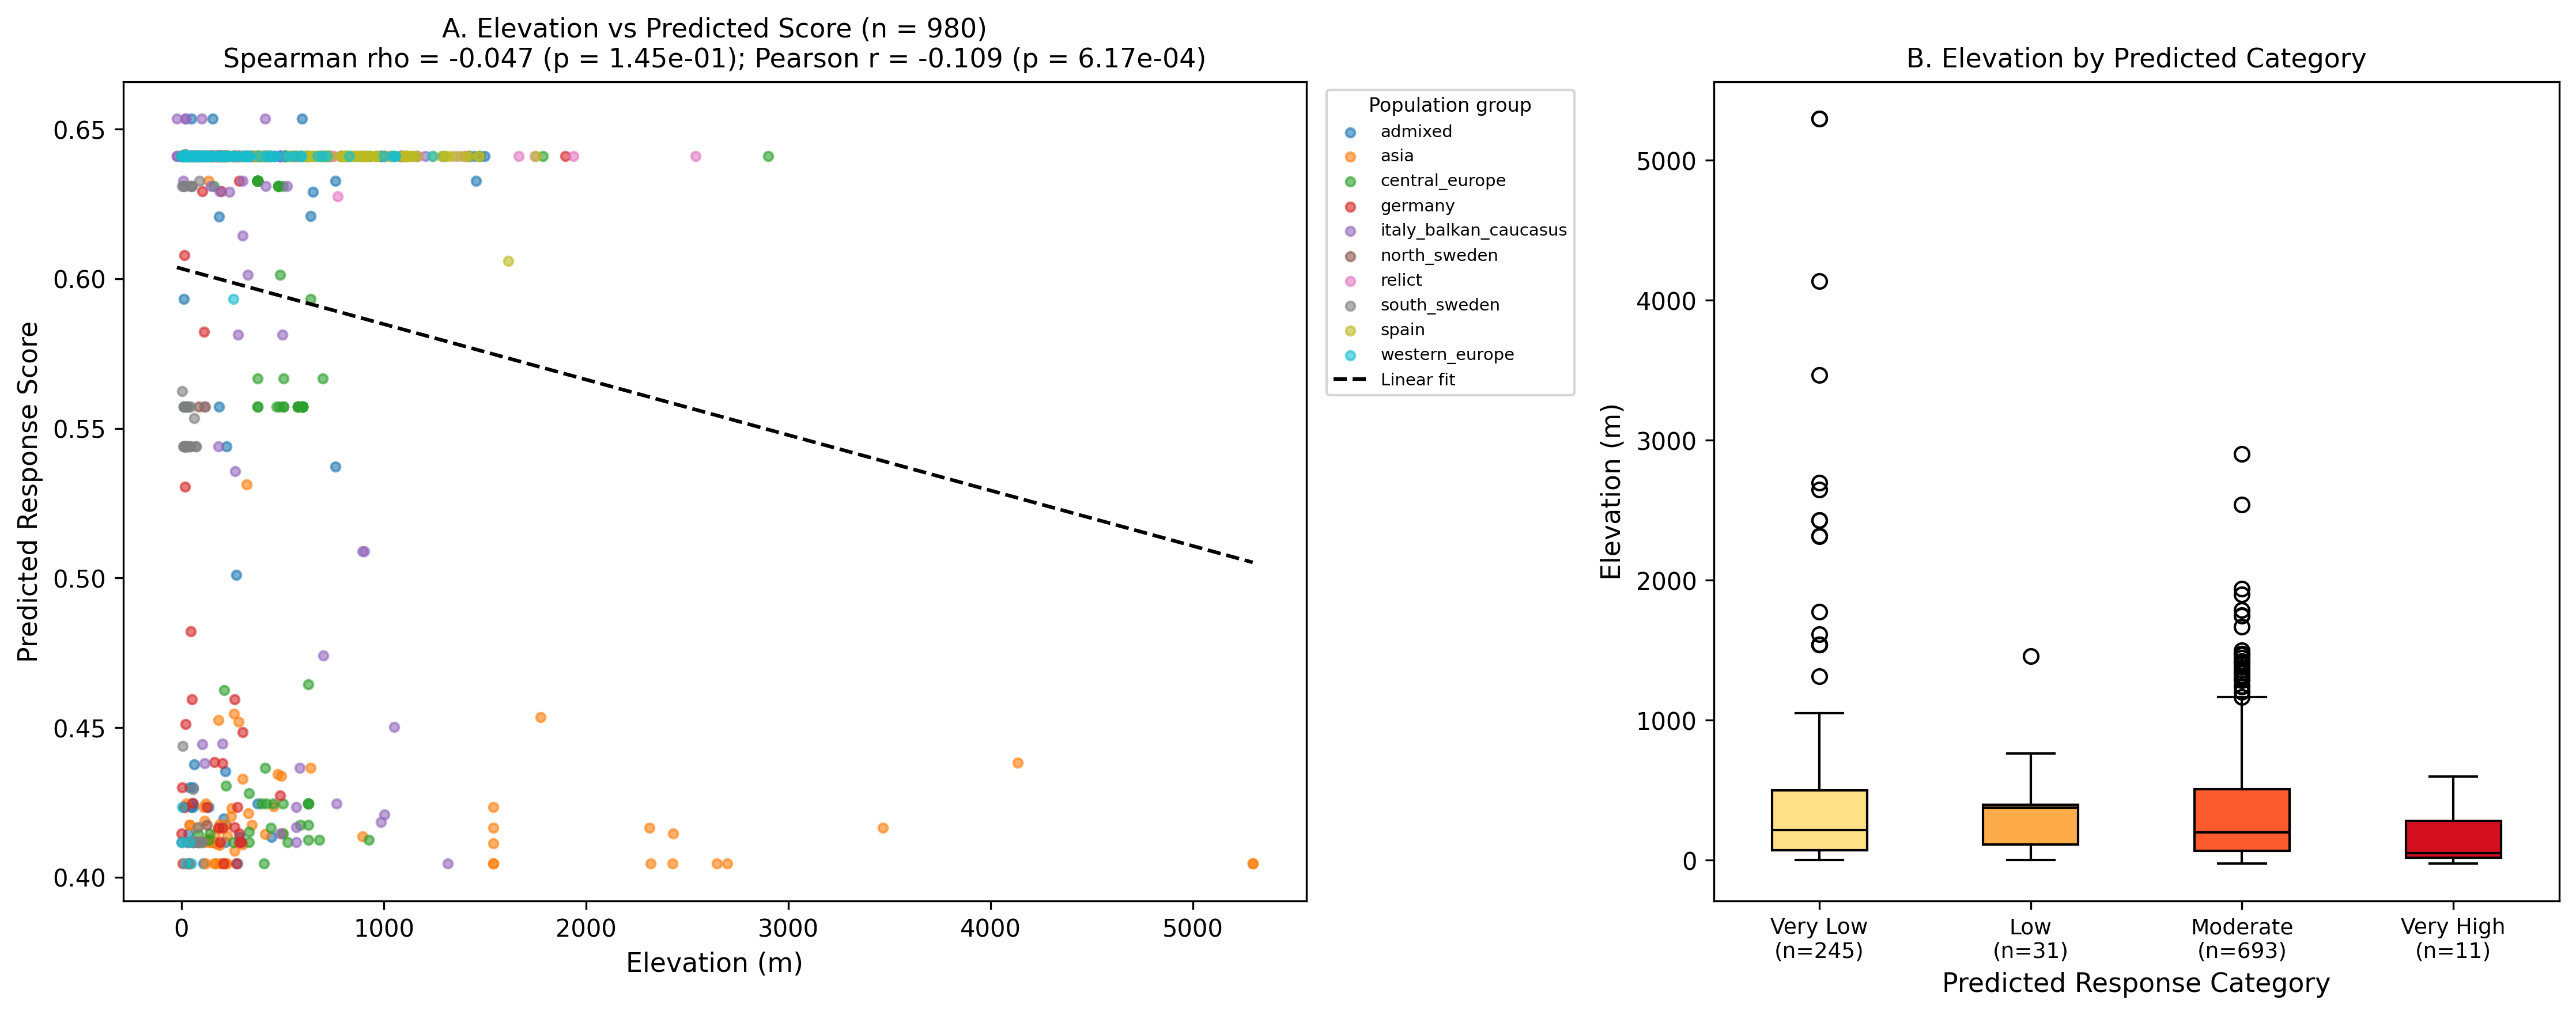
Figure 16: Elevation vs. Response Score Regression
(A) Elevation against predicted score for the 980 accessions with elevation data (Spearman ρ = −0.047, p = 0.145; Pearson r = −0.109). (B) Elevation by predicted category. Script: code/34_fig16_altitude_score.py.
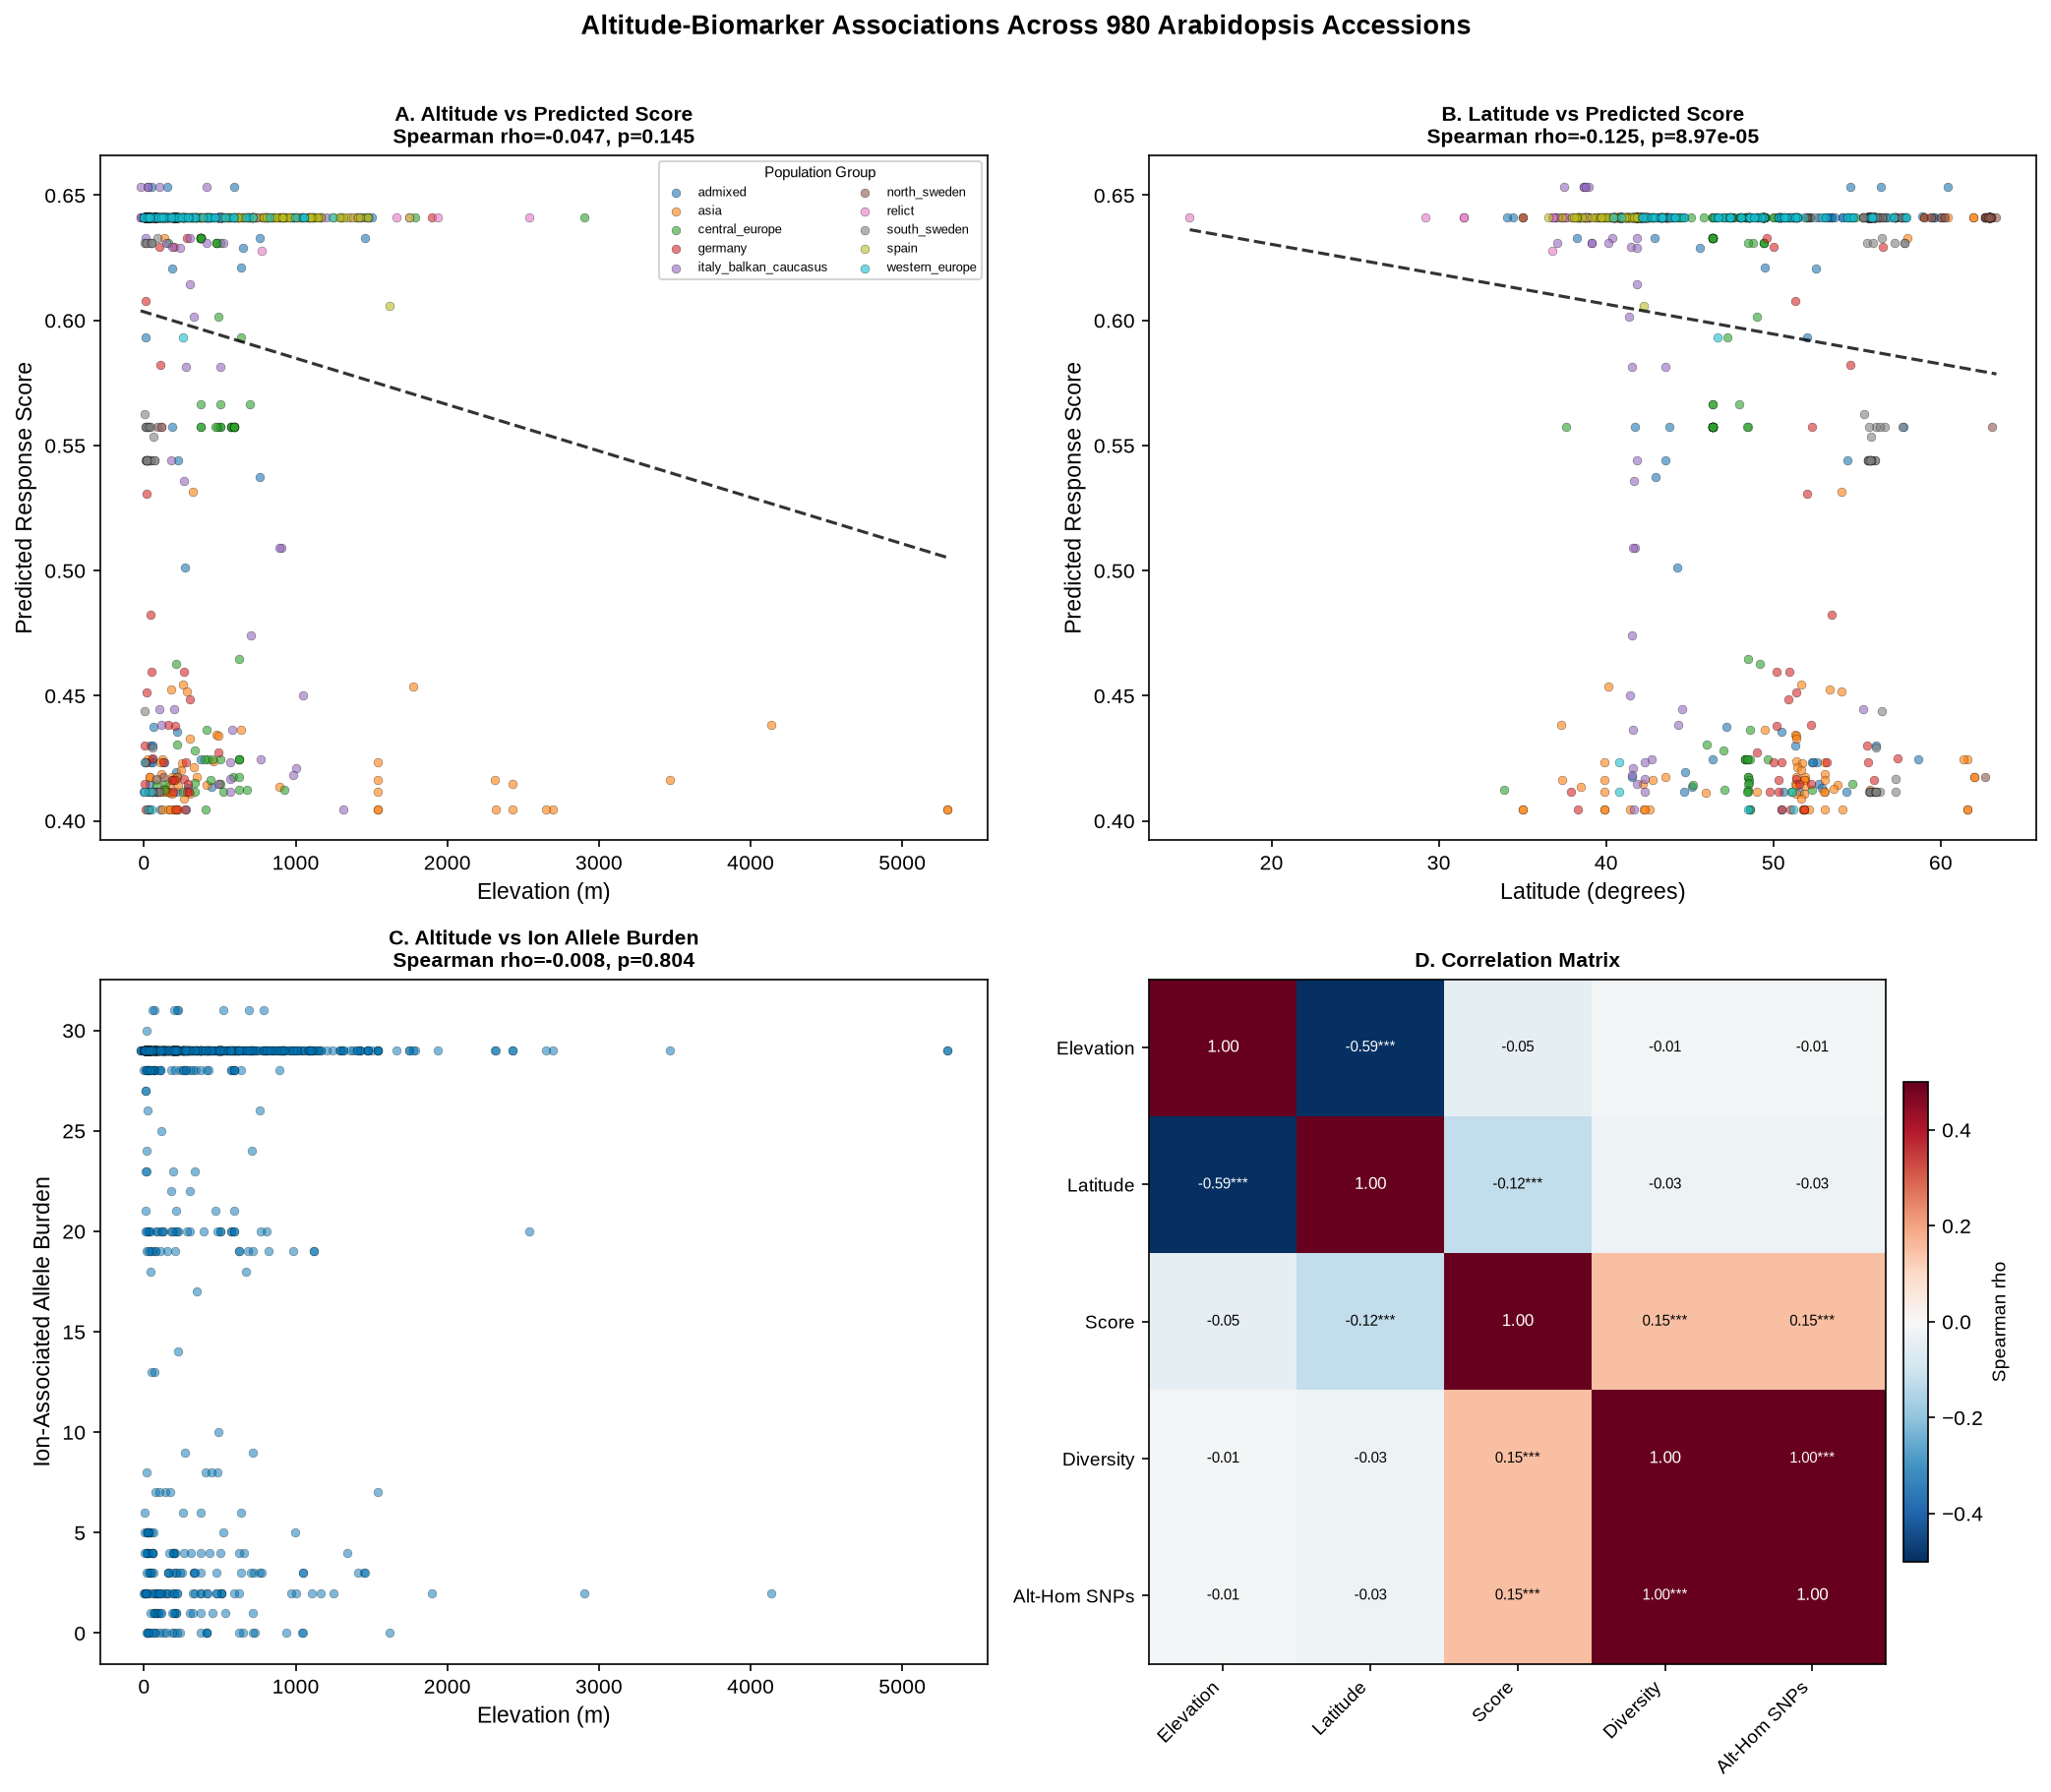
Figure 17: Multi-Panel Altitude & Biomarker Diagnostics
Four-panel analysis of elevation, latitude and predicted score. Panel C's “ion-associated allele burden” is the same variable as the alternate homozygous SNP count, and the loci concerned are metabolite-feature loci, not ionome loci.
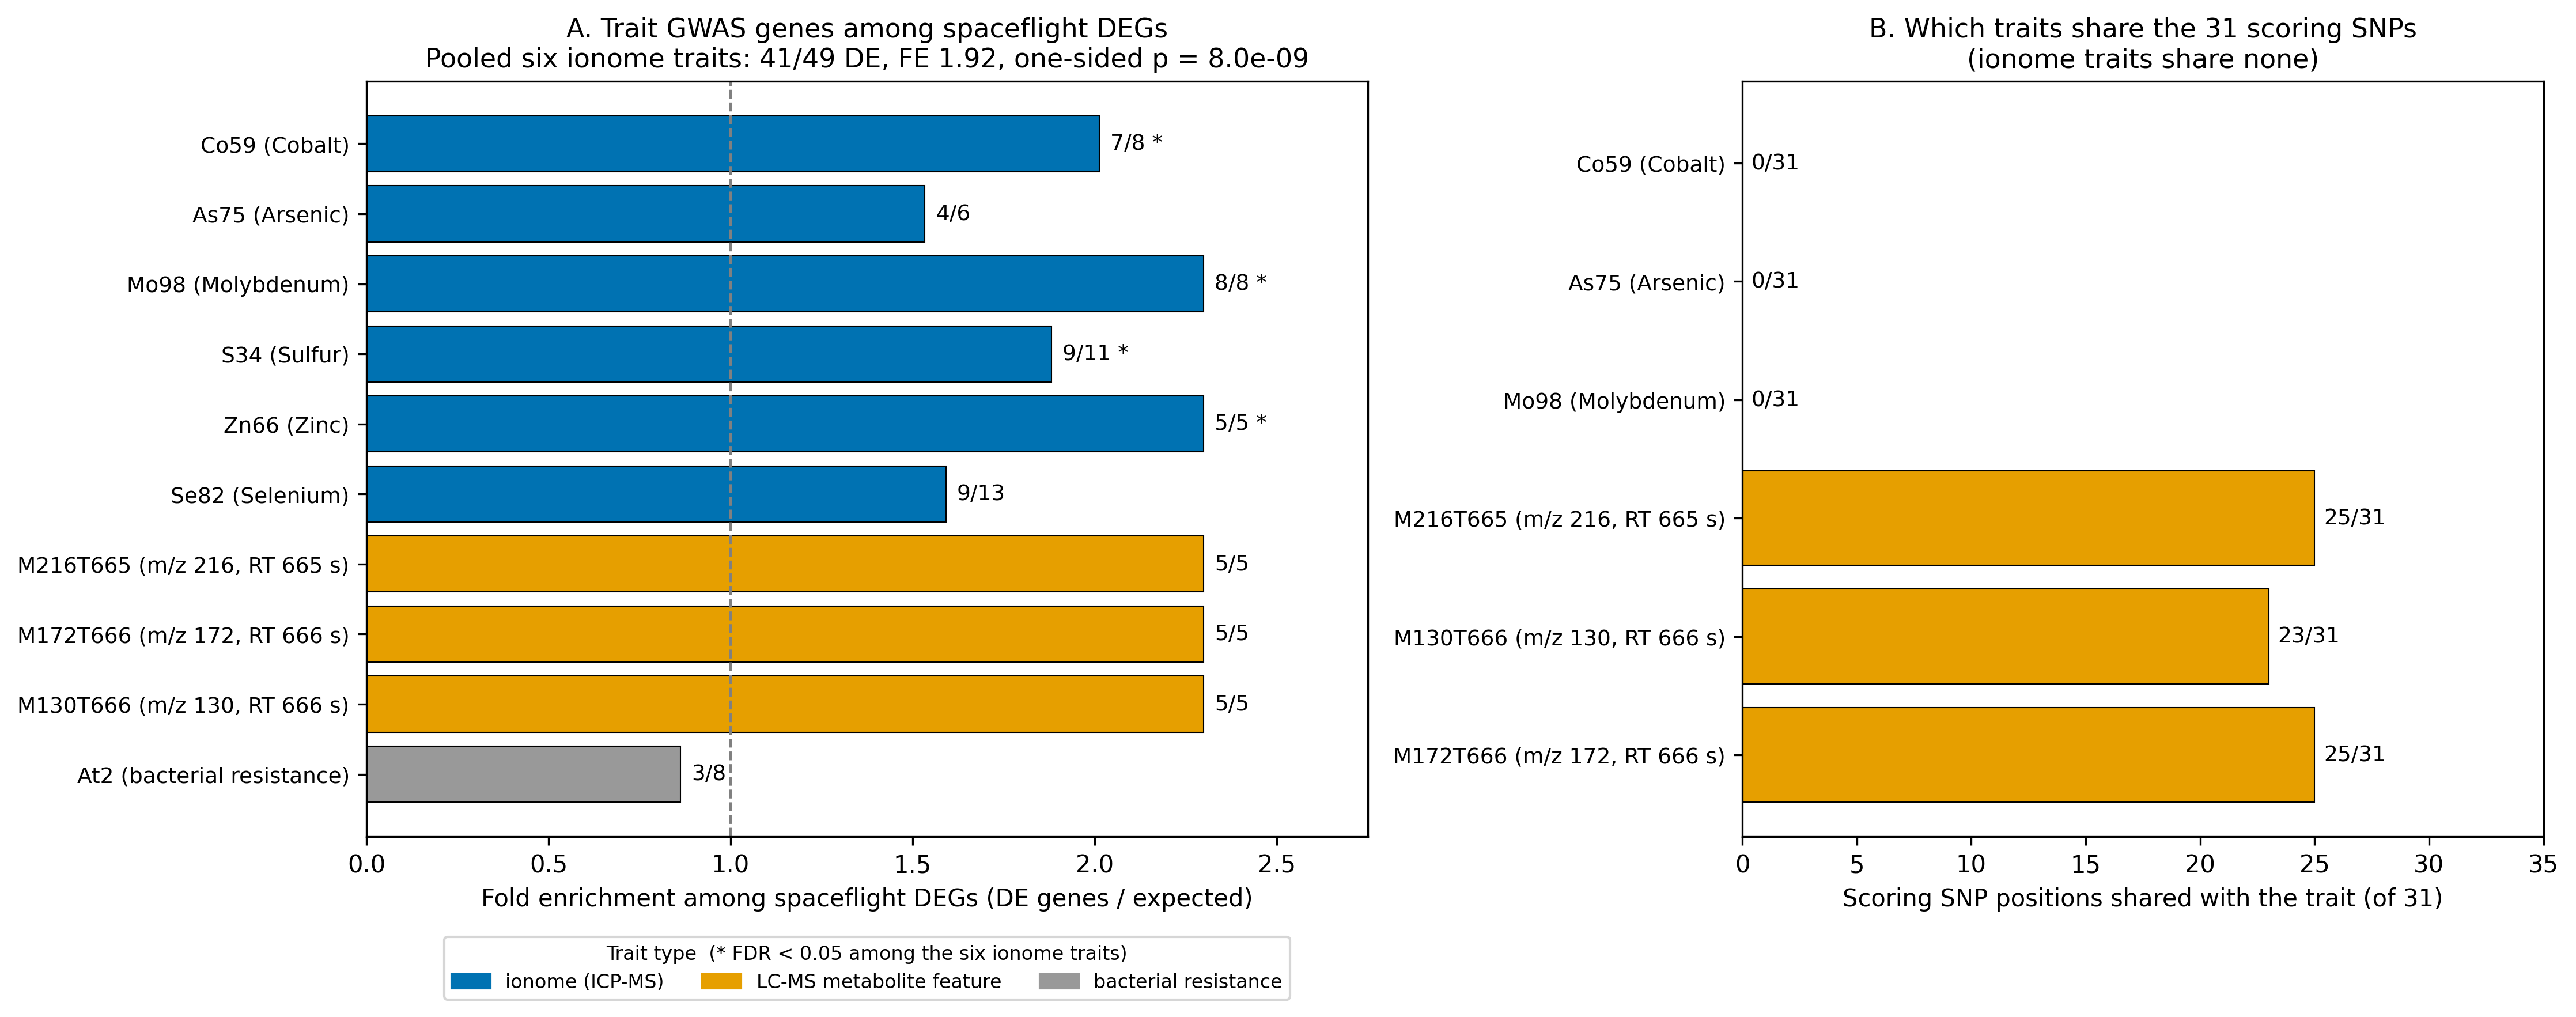
Figure 18: Leaf Ionome GWAS Genes Among Spaceflight DEGs
(A) Fold enrichment of each trait's GWAS genes among spaceflight DEGs. Pooled over the six ICP-MS ionome traits, 41 of 49 genes are DE (fold enrichment 1.92, one-sided Fisher p = 8.0e-9). The three LC-MS metabolite features and At2 (bacterial resistance) are shown separately; they are not ion traits. (B) How many of the 31 scoring SNPs each trait shares. Script: code/30_ionome_enrichment.py.
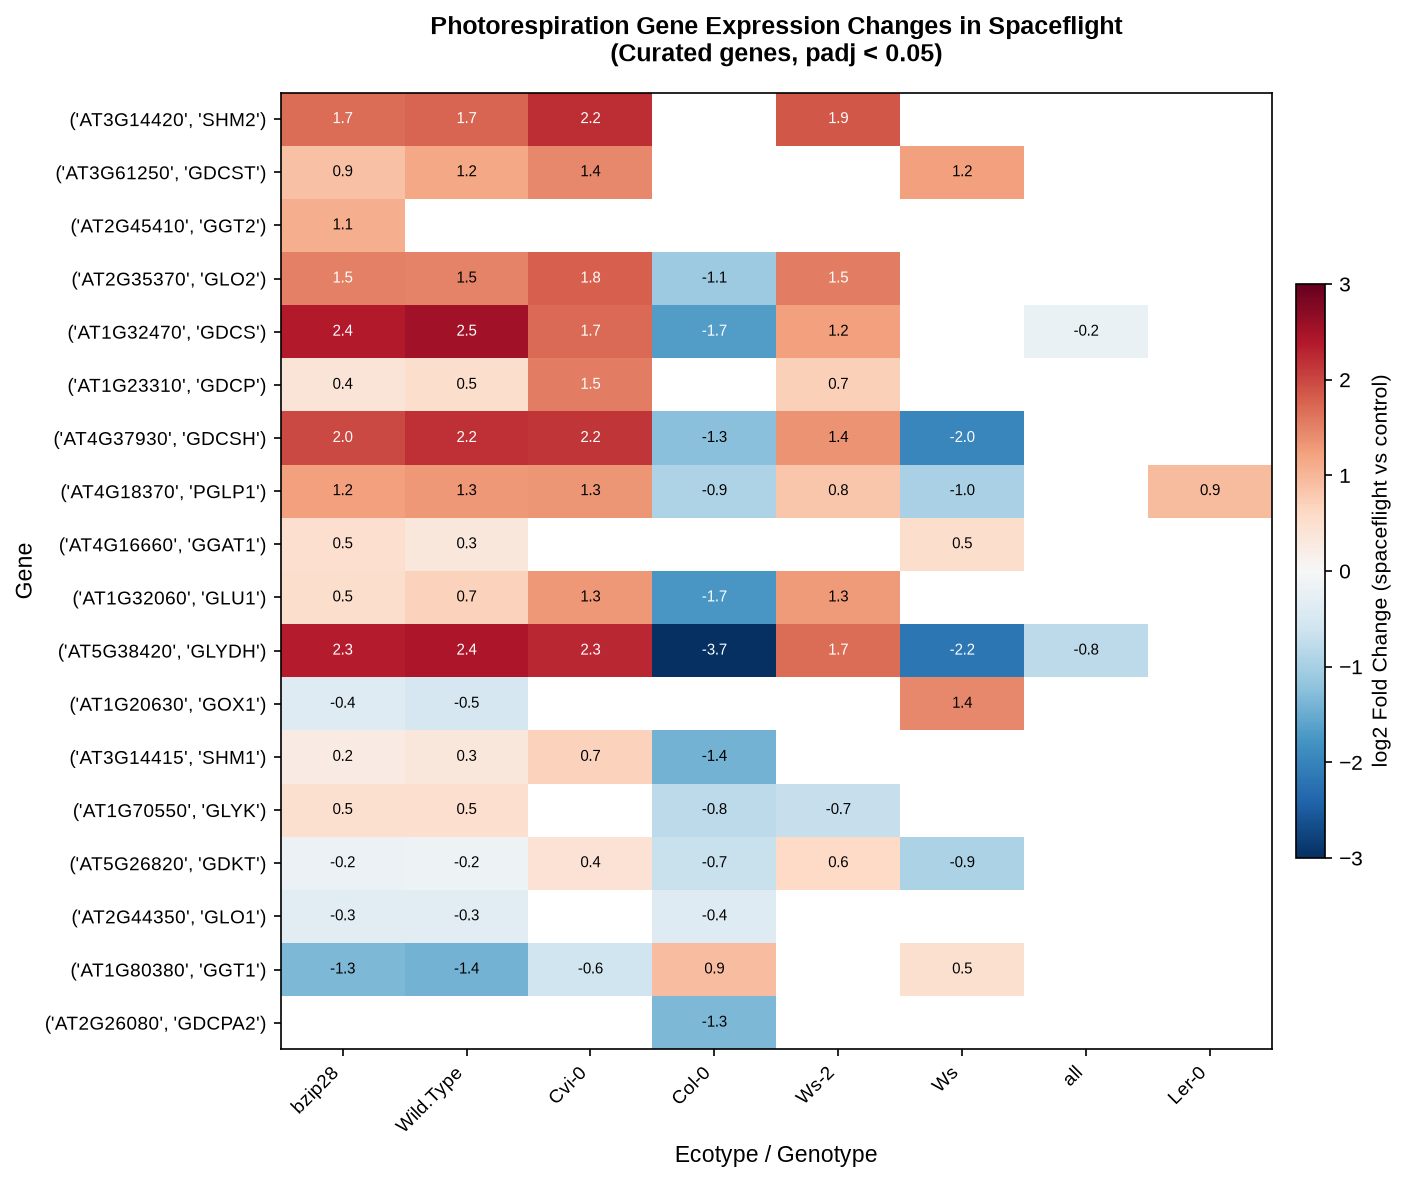
Figure 19: Photorespiratory C2 Cycle Expression Heatmap
Log2 fold changes of 18 curated photorespiration genes (padj < 0.05) across ecotype and genotype comparisons, including mutant and pooled comparisons. Overall, 53 of 56 photorespiration genes are differentially expressed.
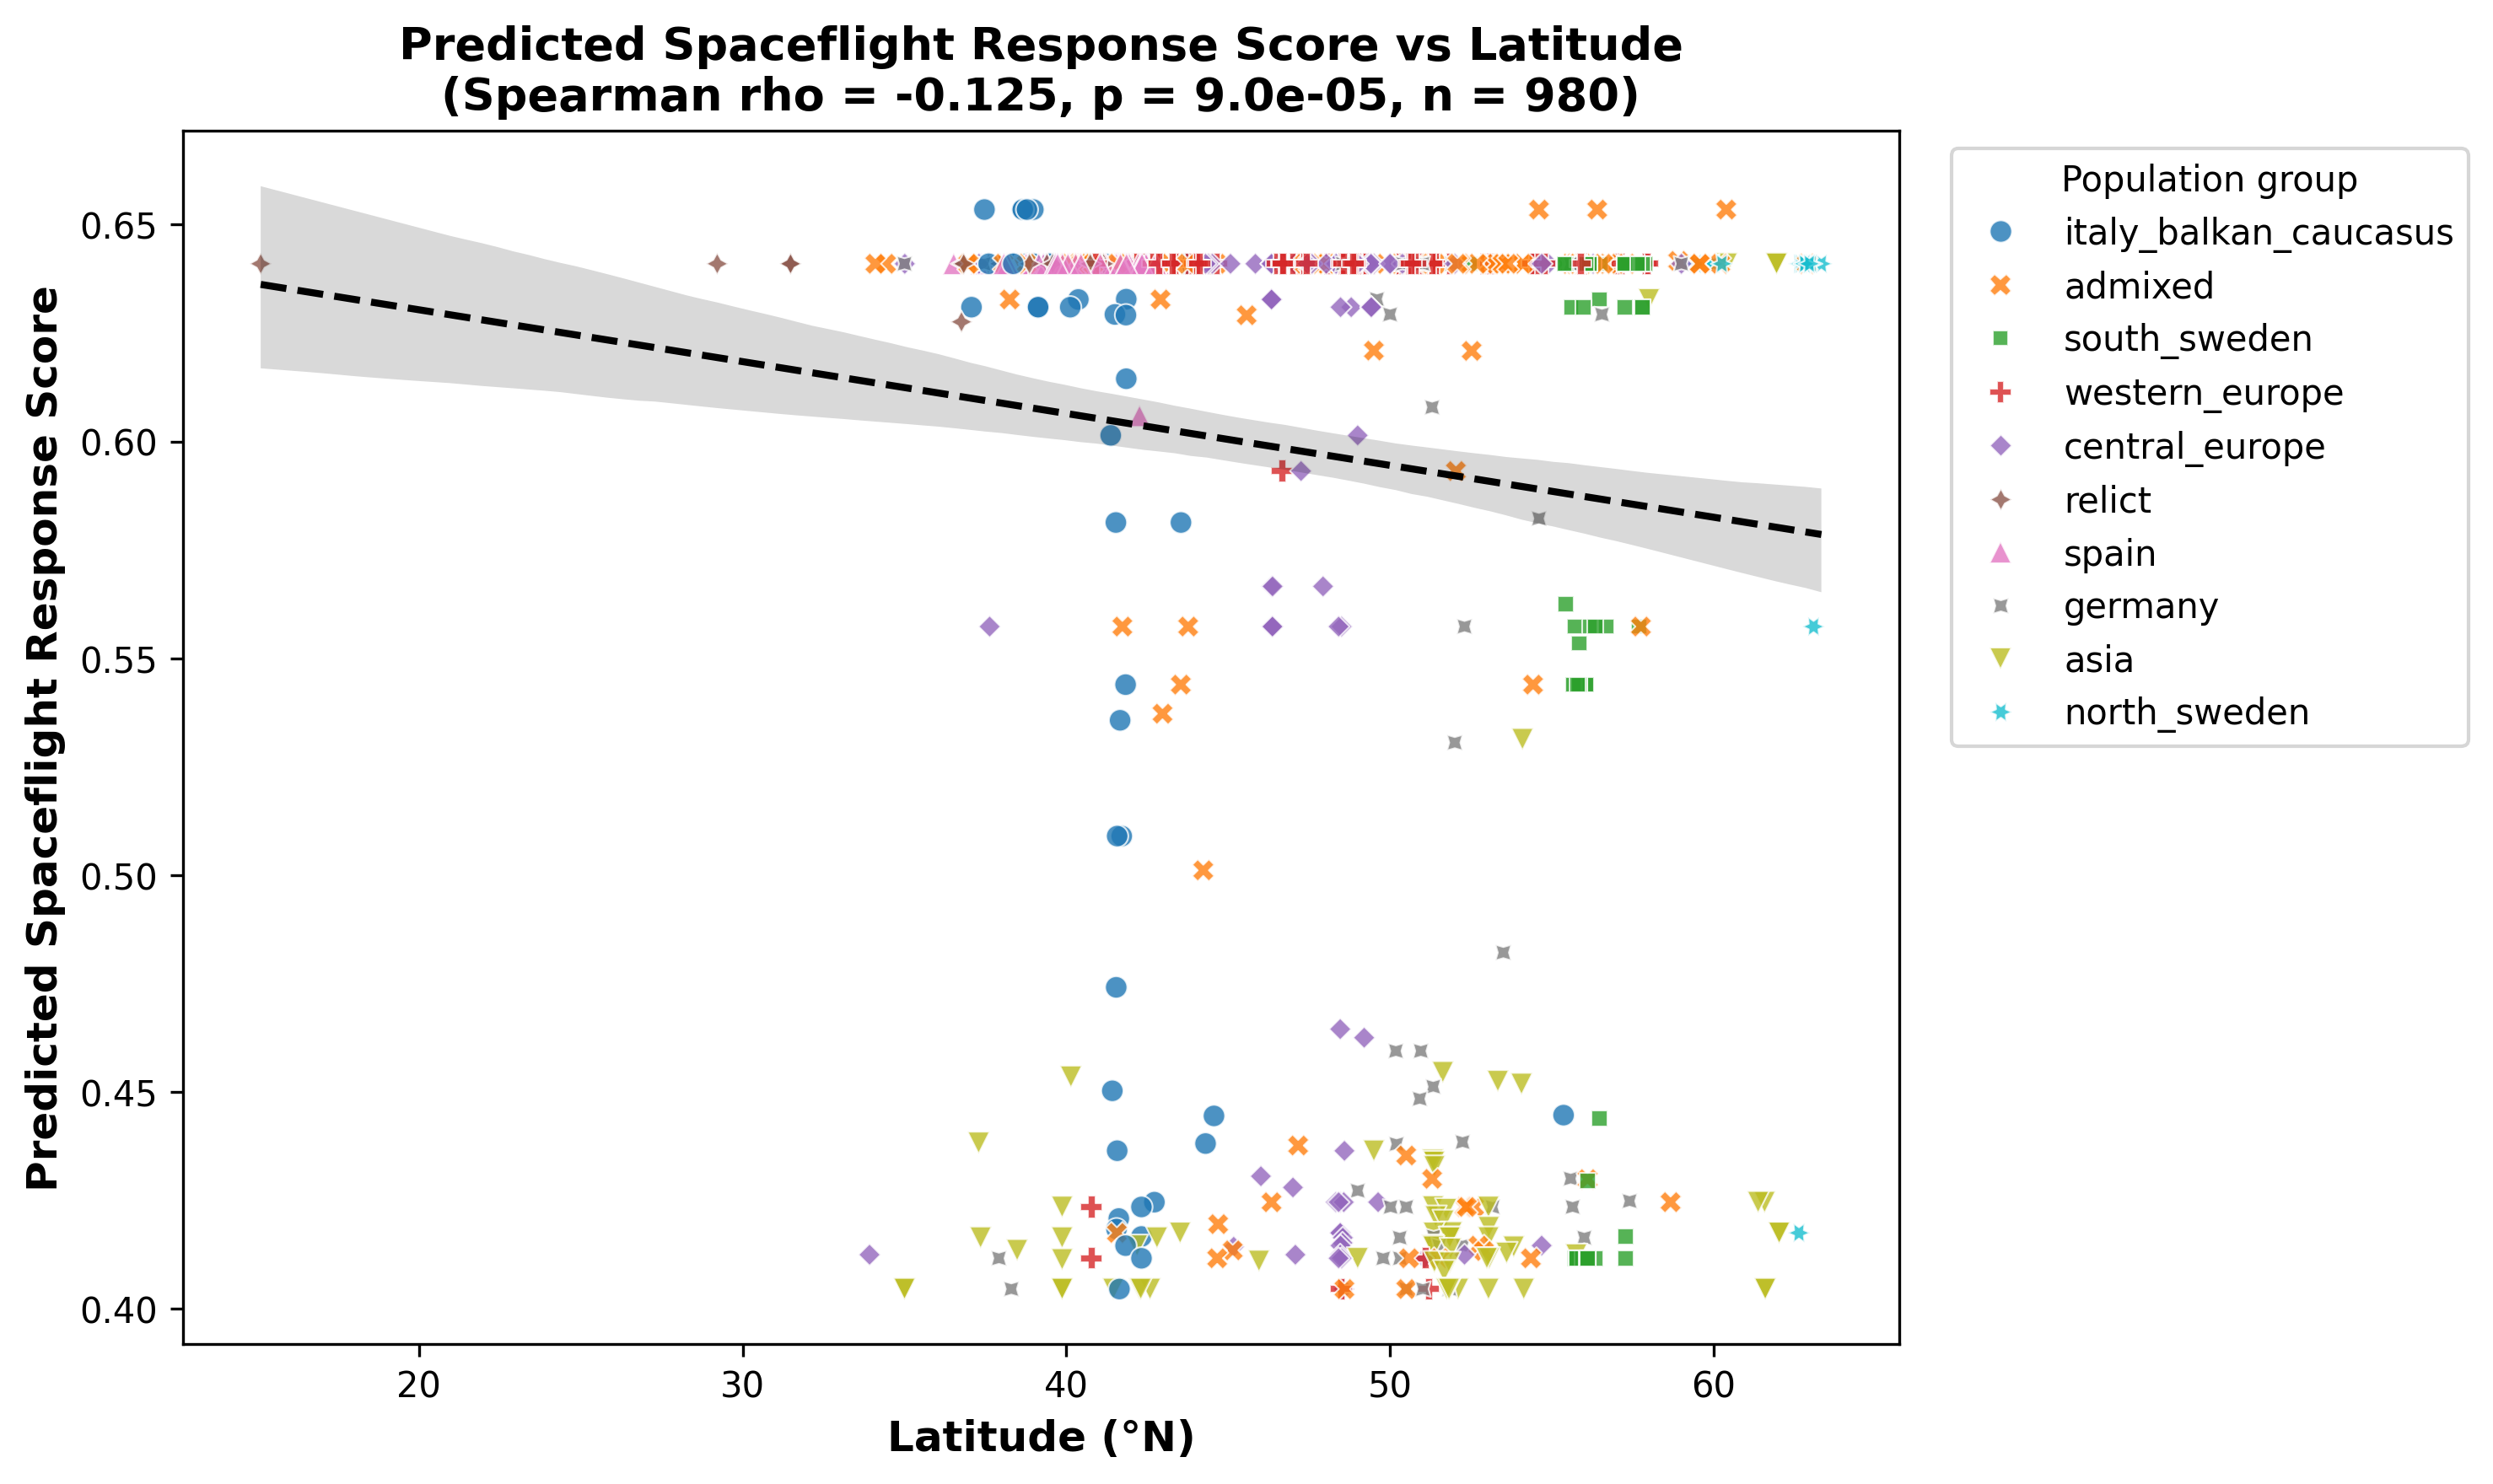
Figure 22: Latitudinal Clinal Score Variation
Scatter plot with population group color coding highlighting clinal latitudinal gradients in spaceflight response distinctness.
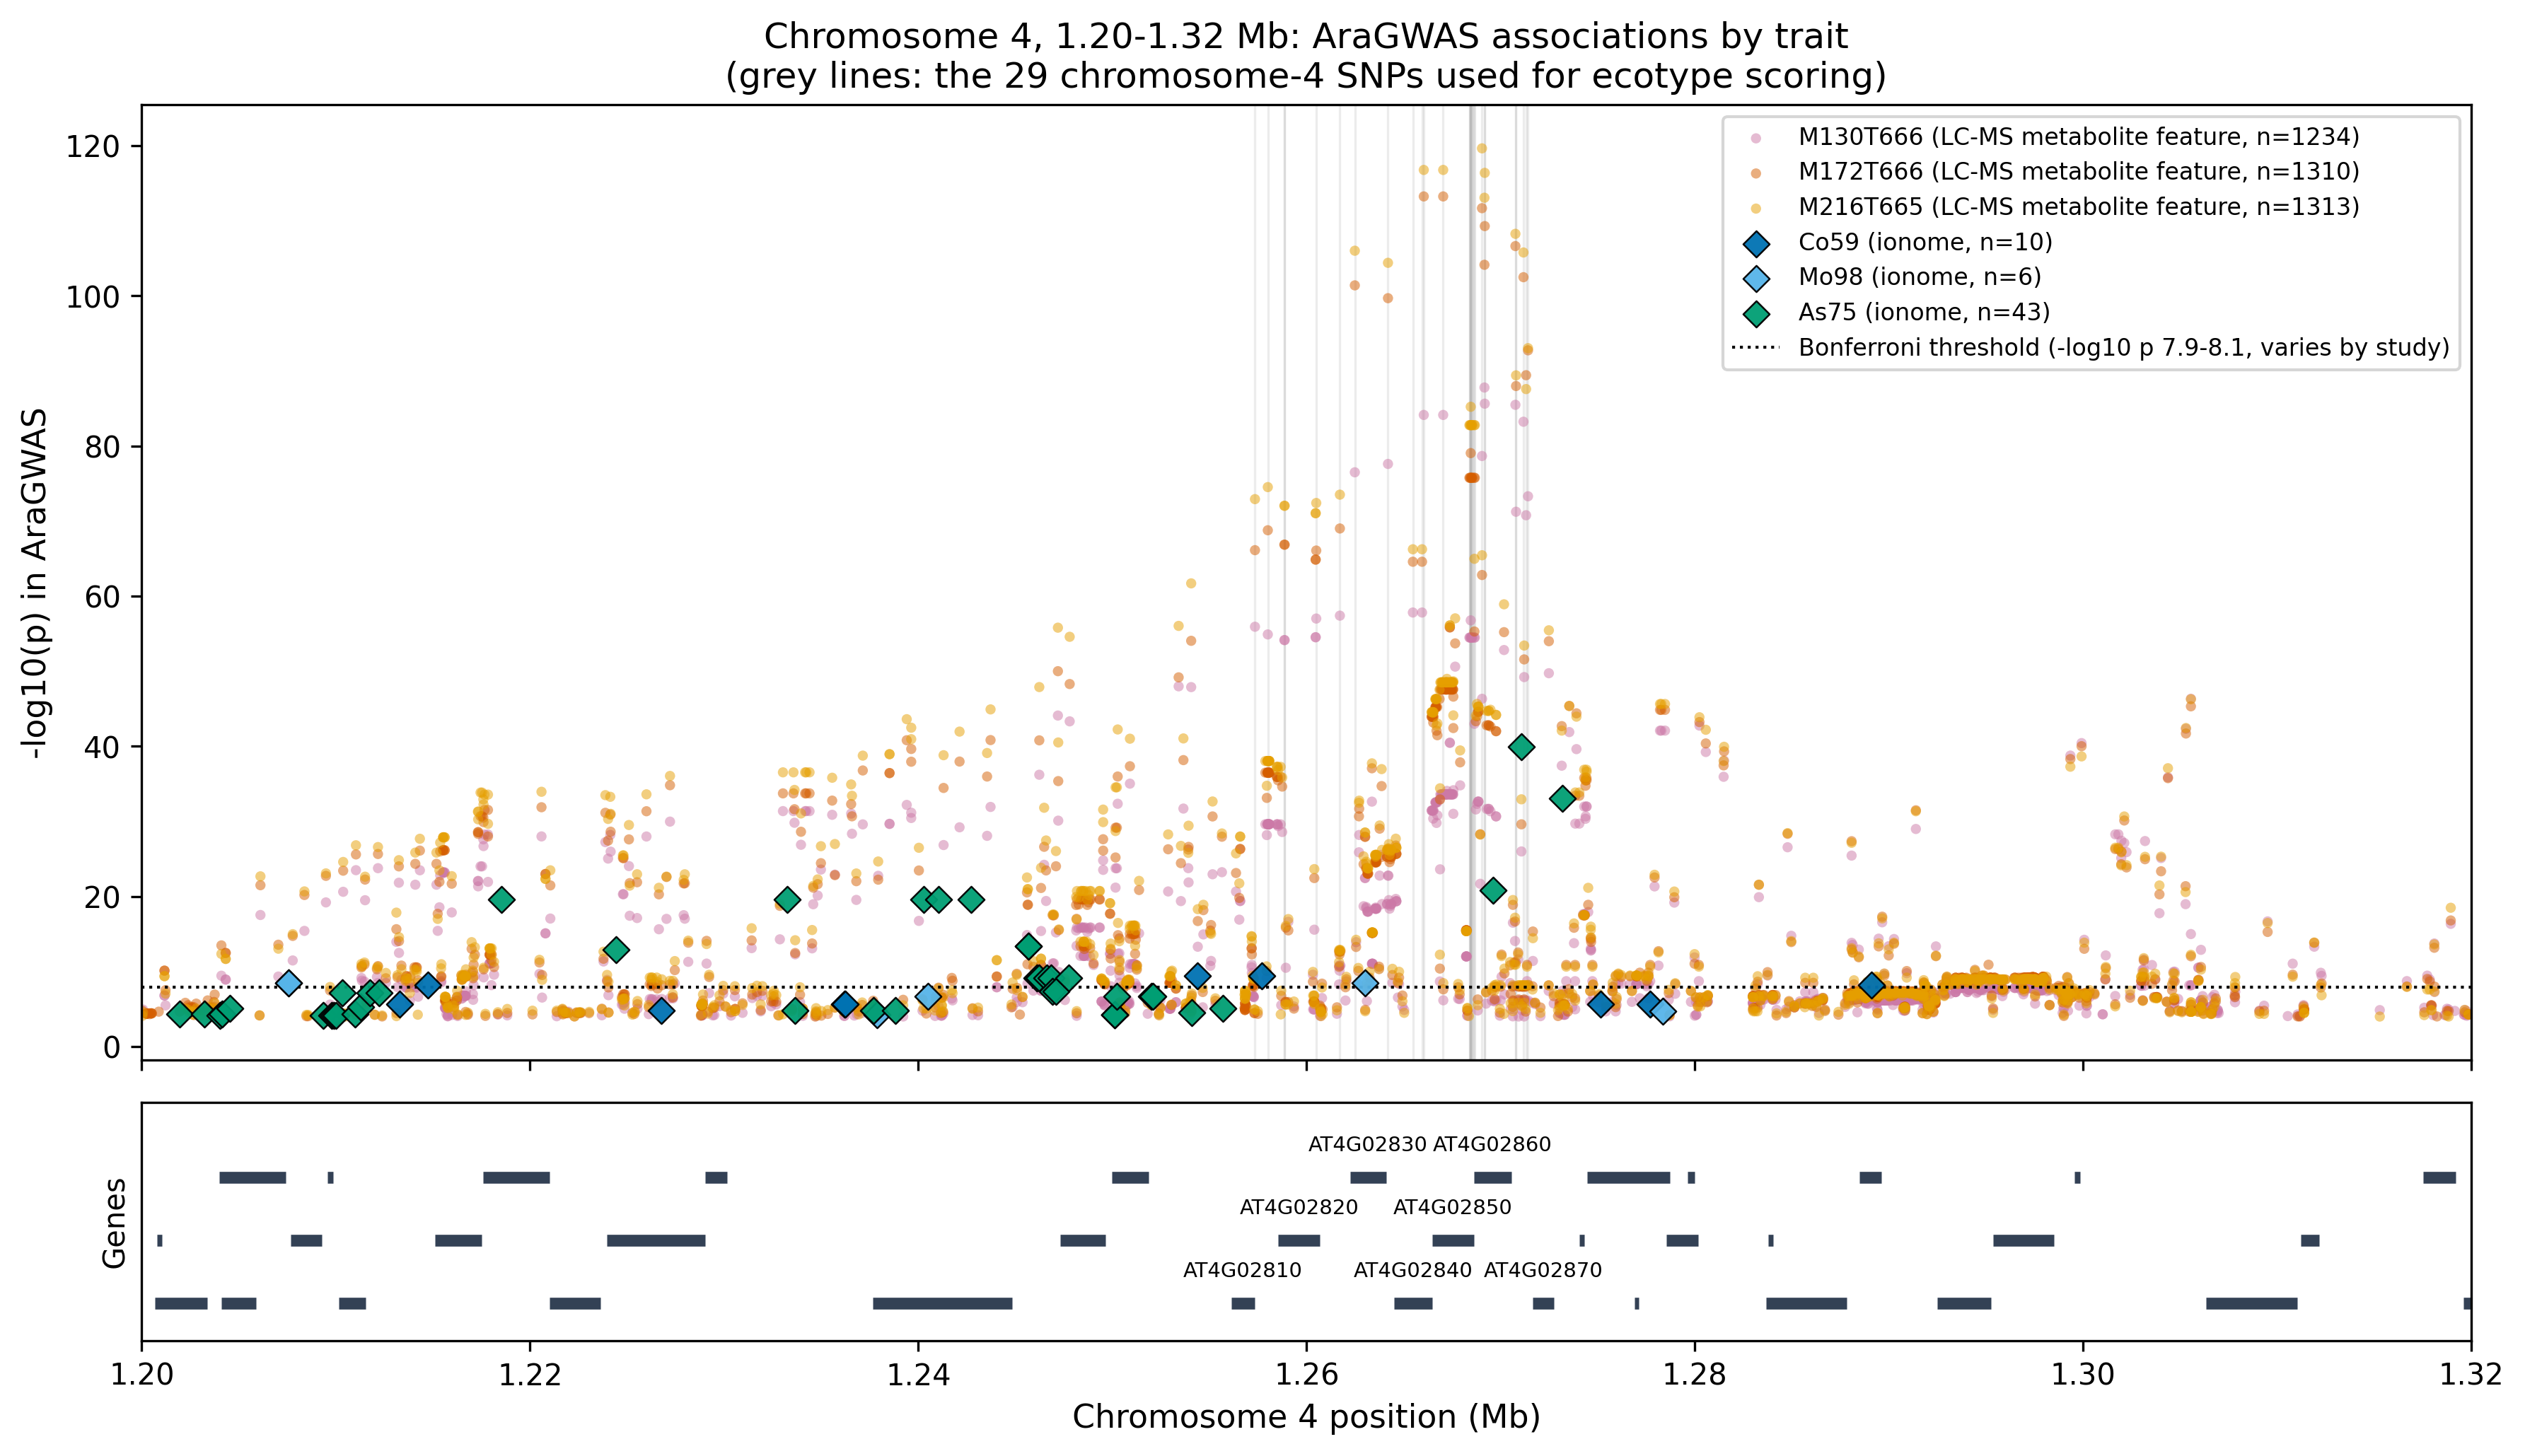
Figure 23: Chromosome 4 Window in the AraGWAS Catalog
Every association stored in AraGWAS (−log10 p ≥ 4) between 1.20 and 1.32 Mb for the three LC-MS metabolite-feature studies and the cobalt, molybdenum and arsenic studies; grey lines mark the 29 scoring SNPs, and genes are from the AraGWAS gene database. The scoring SNPs are metabolite-feature hits; arsenic, cobalt and molybdenum associations sit at neighbouring SNPs. Script: code/31_chr4_aragwas_window.py.
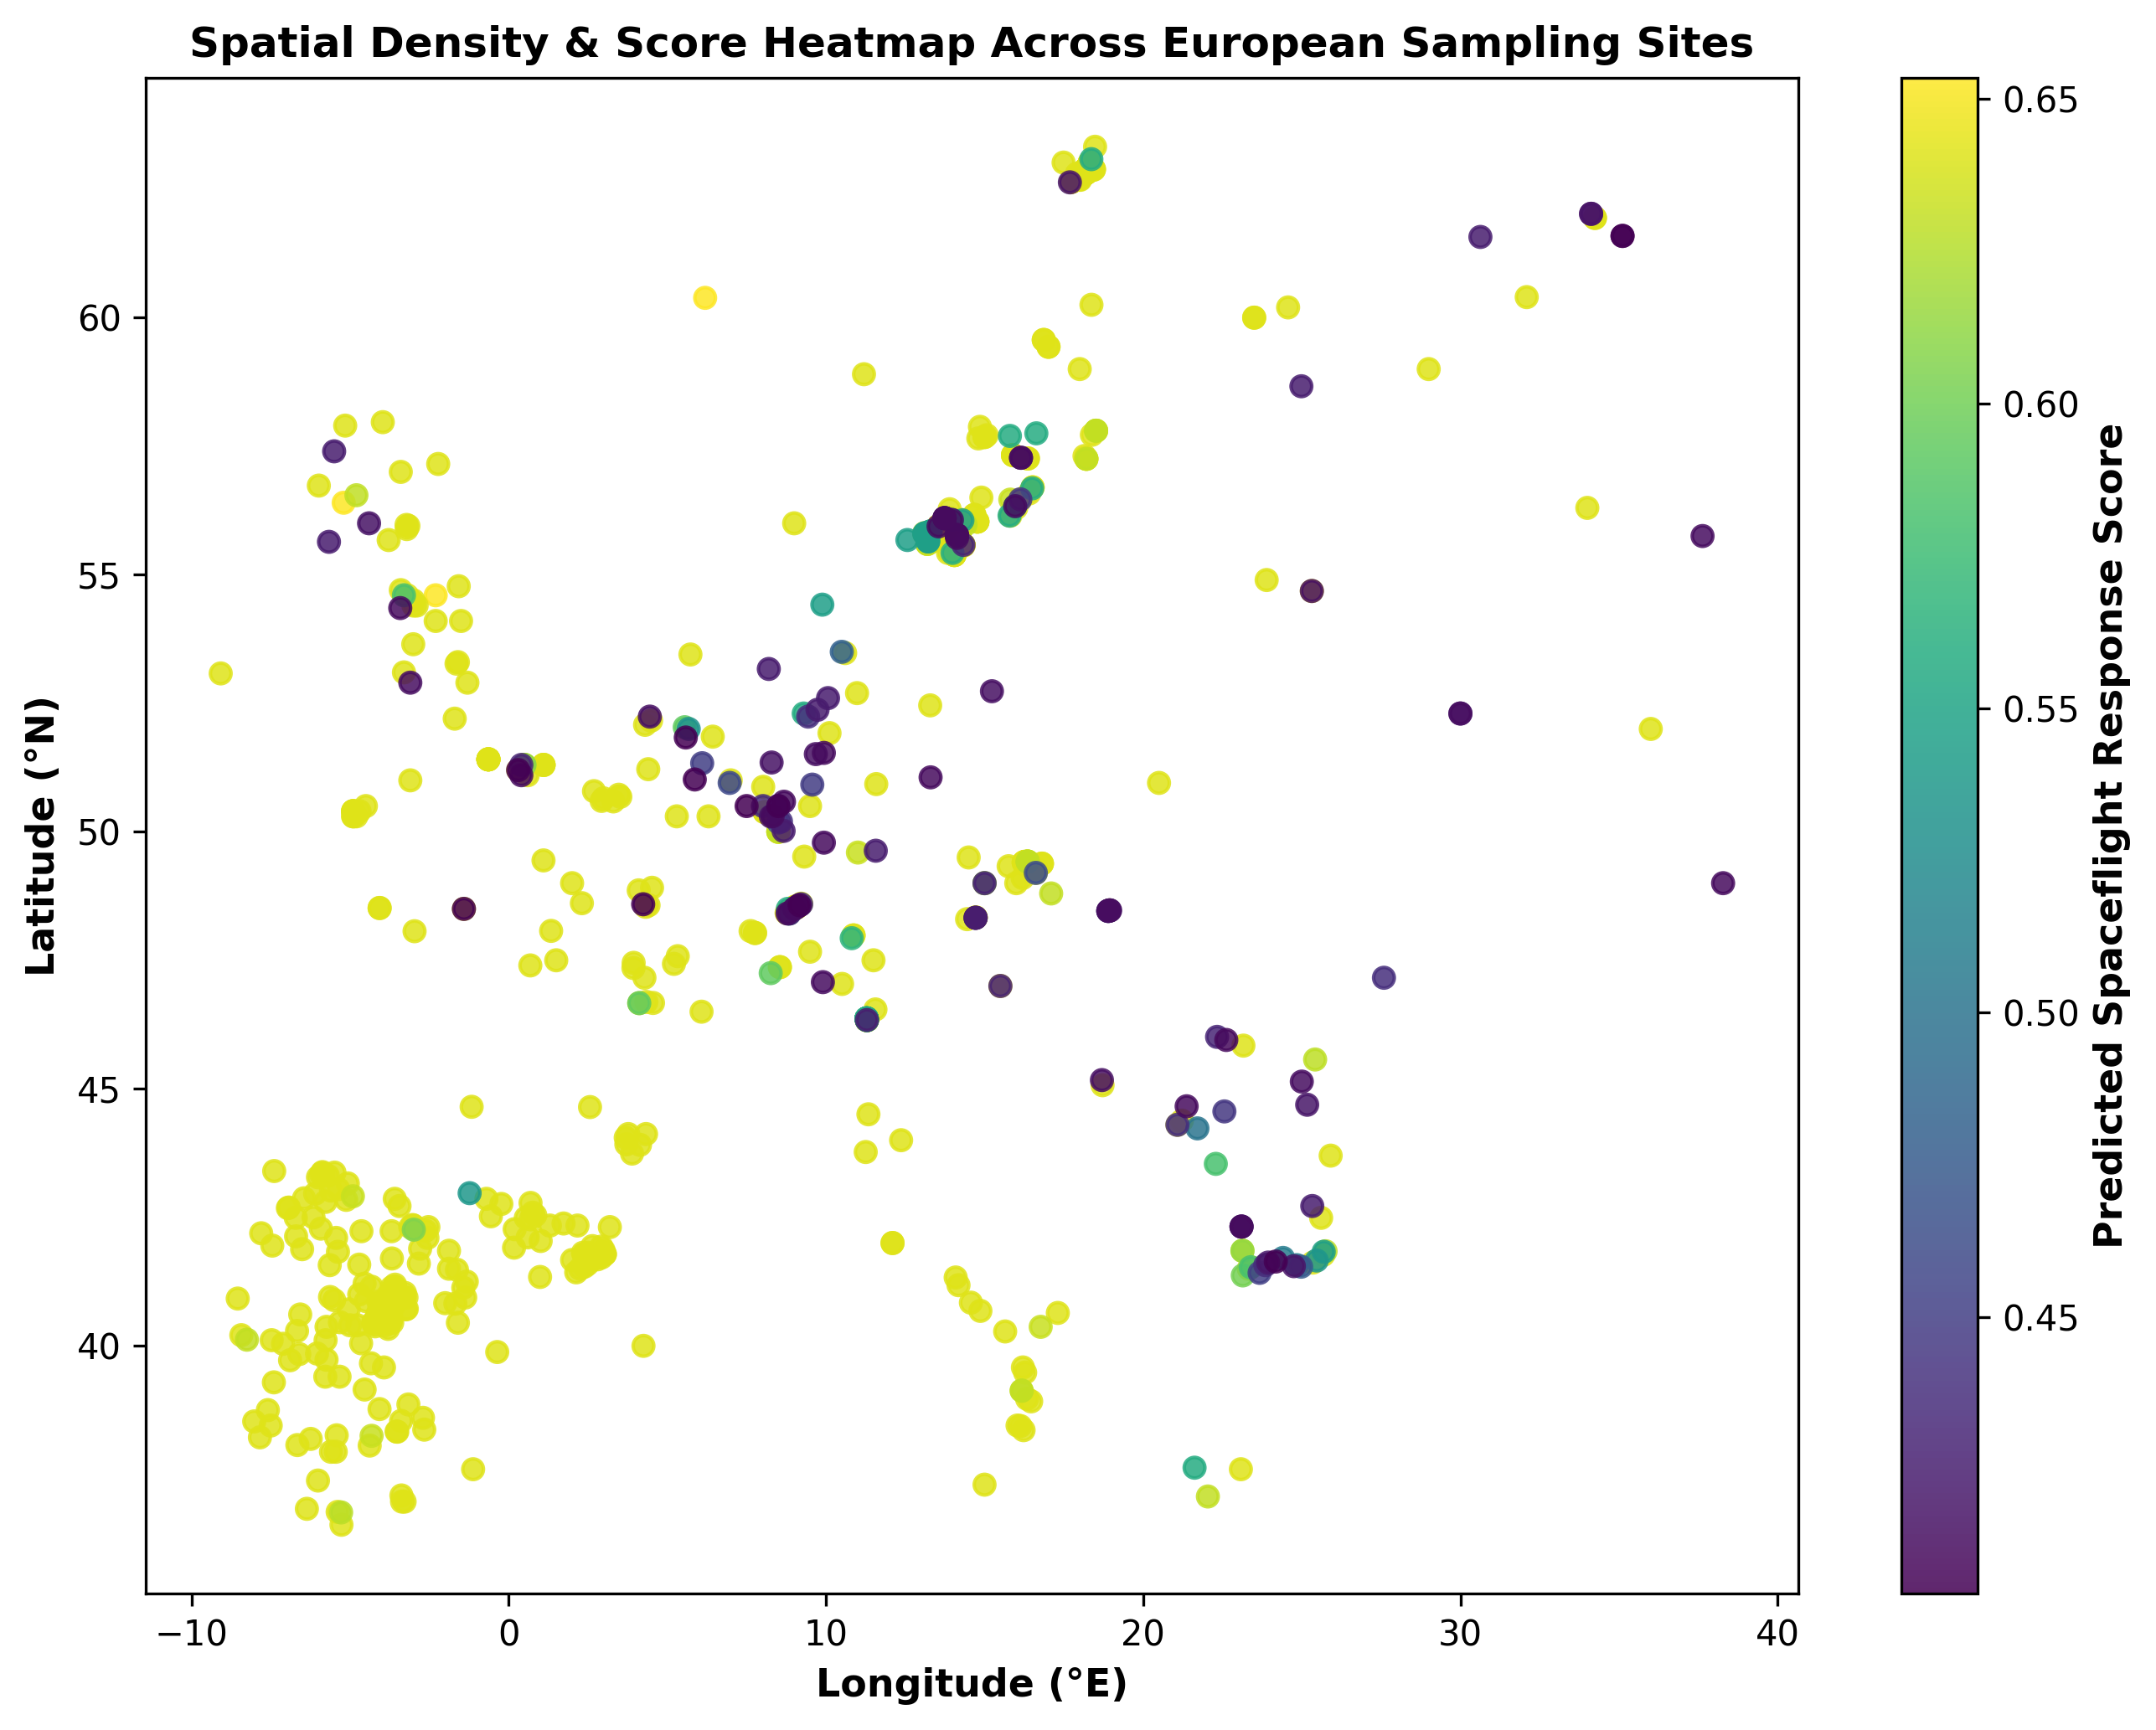
Figure 24: Spatial Heatmap of Predicted Scores over Europe
Predicted spaceflight response score at each European accession's origin (35–70°N, 10°W–40°E).
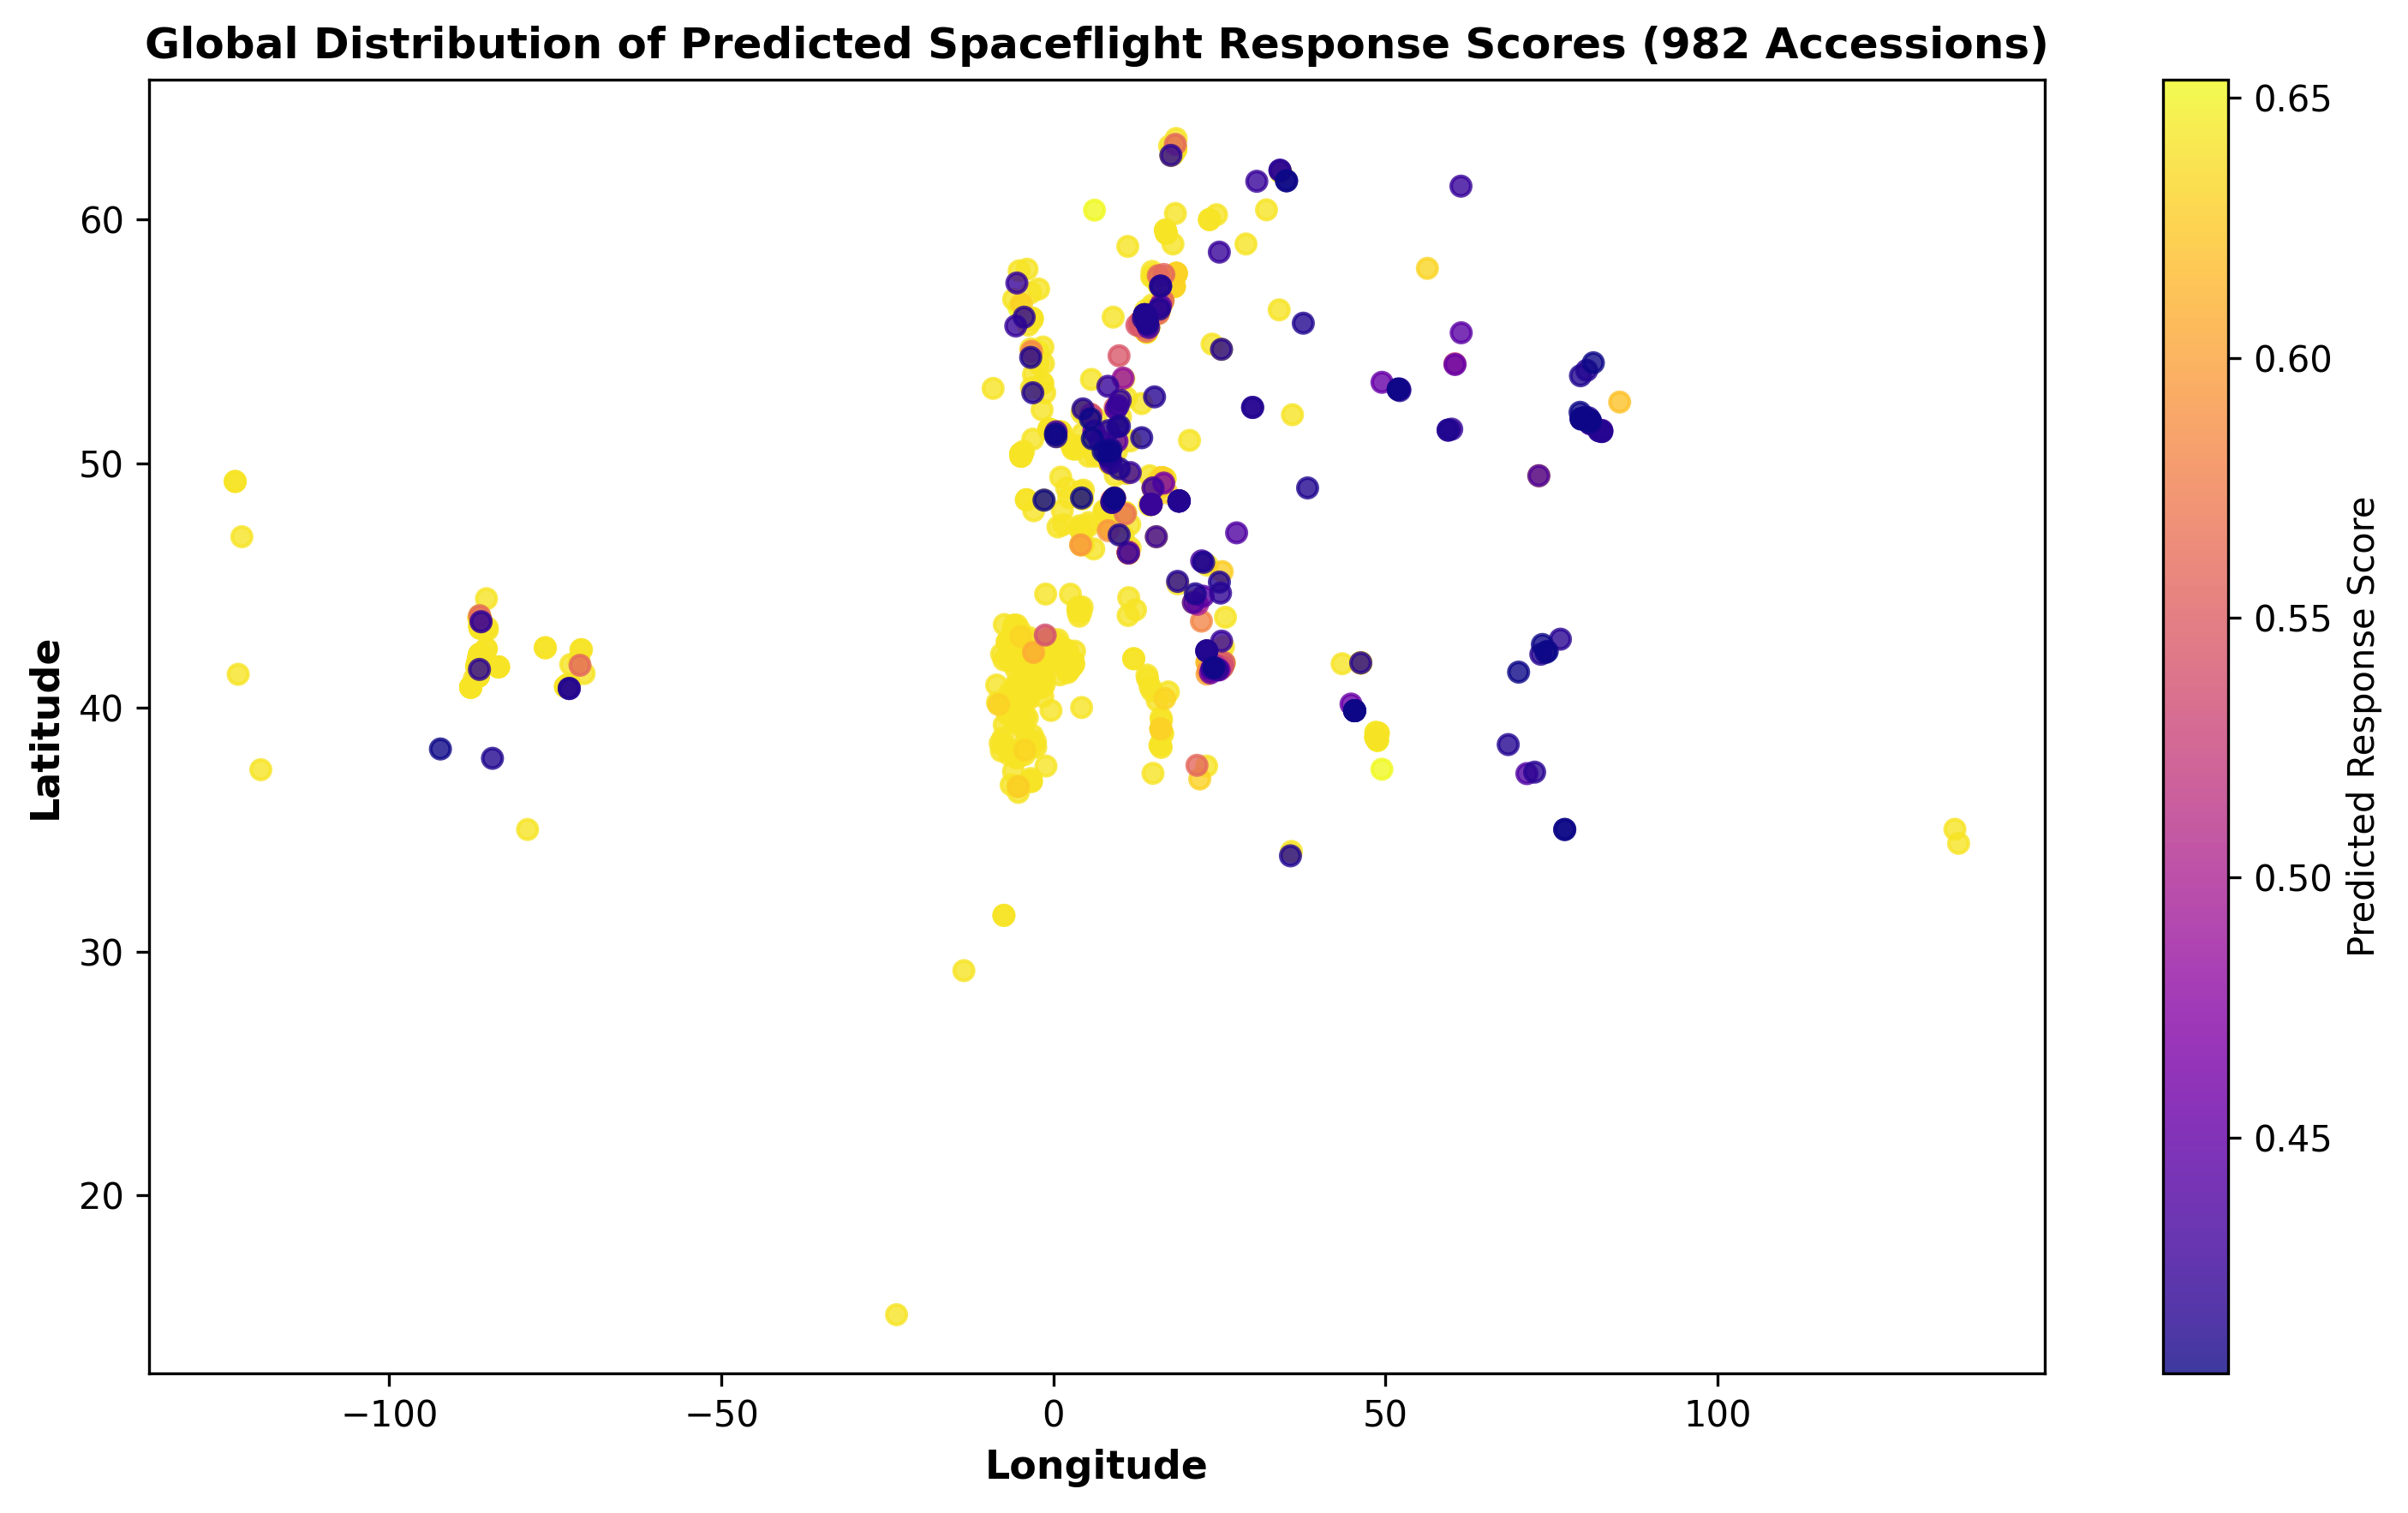
Figure 26: Global Spatial Response Surface
Predicted spaceflight response score at each of the 982 accessions' origins.
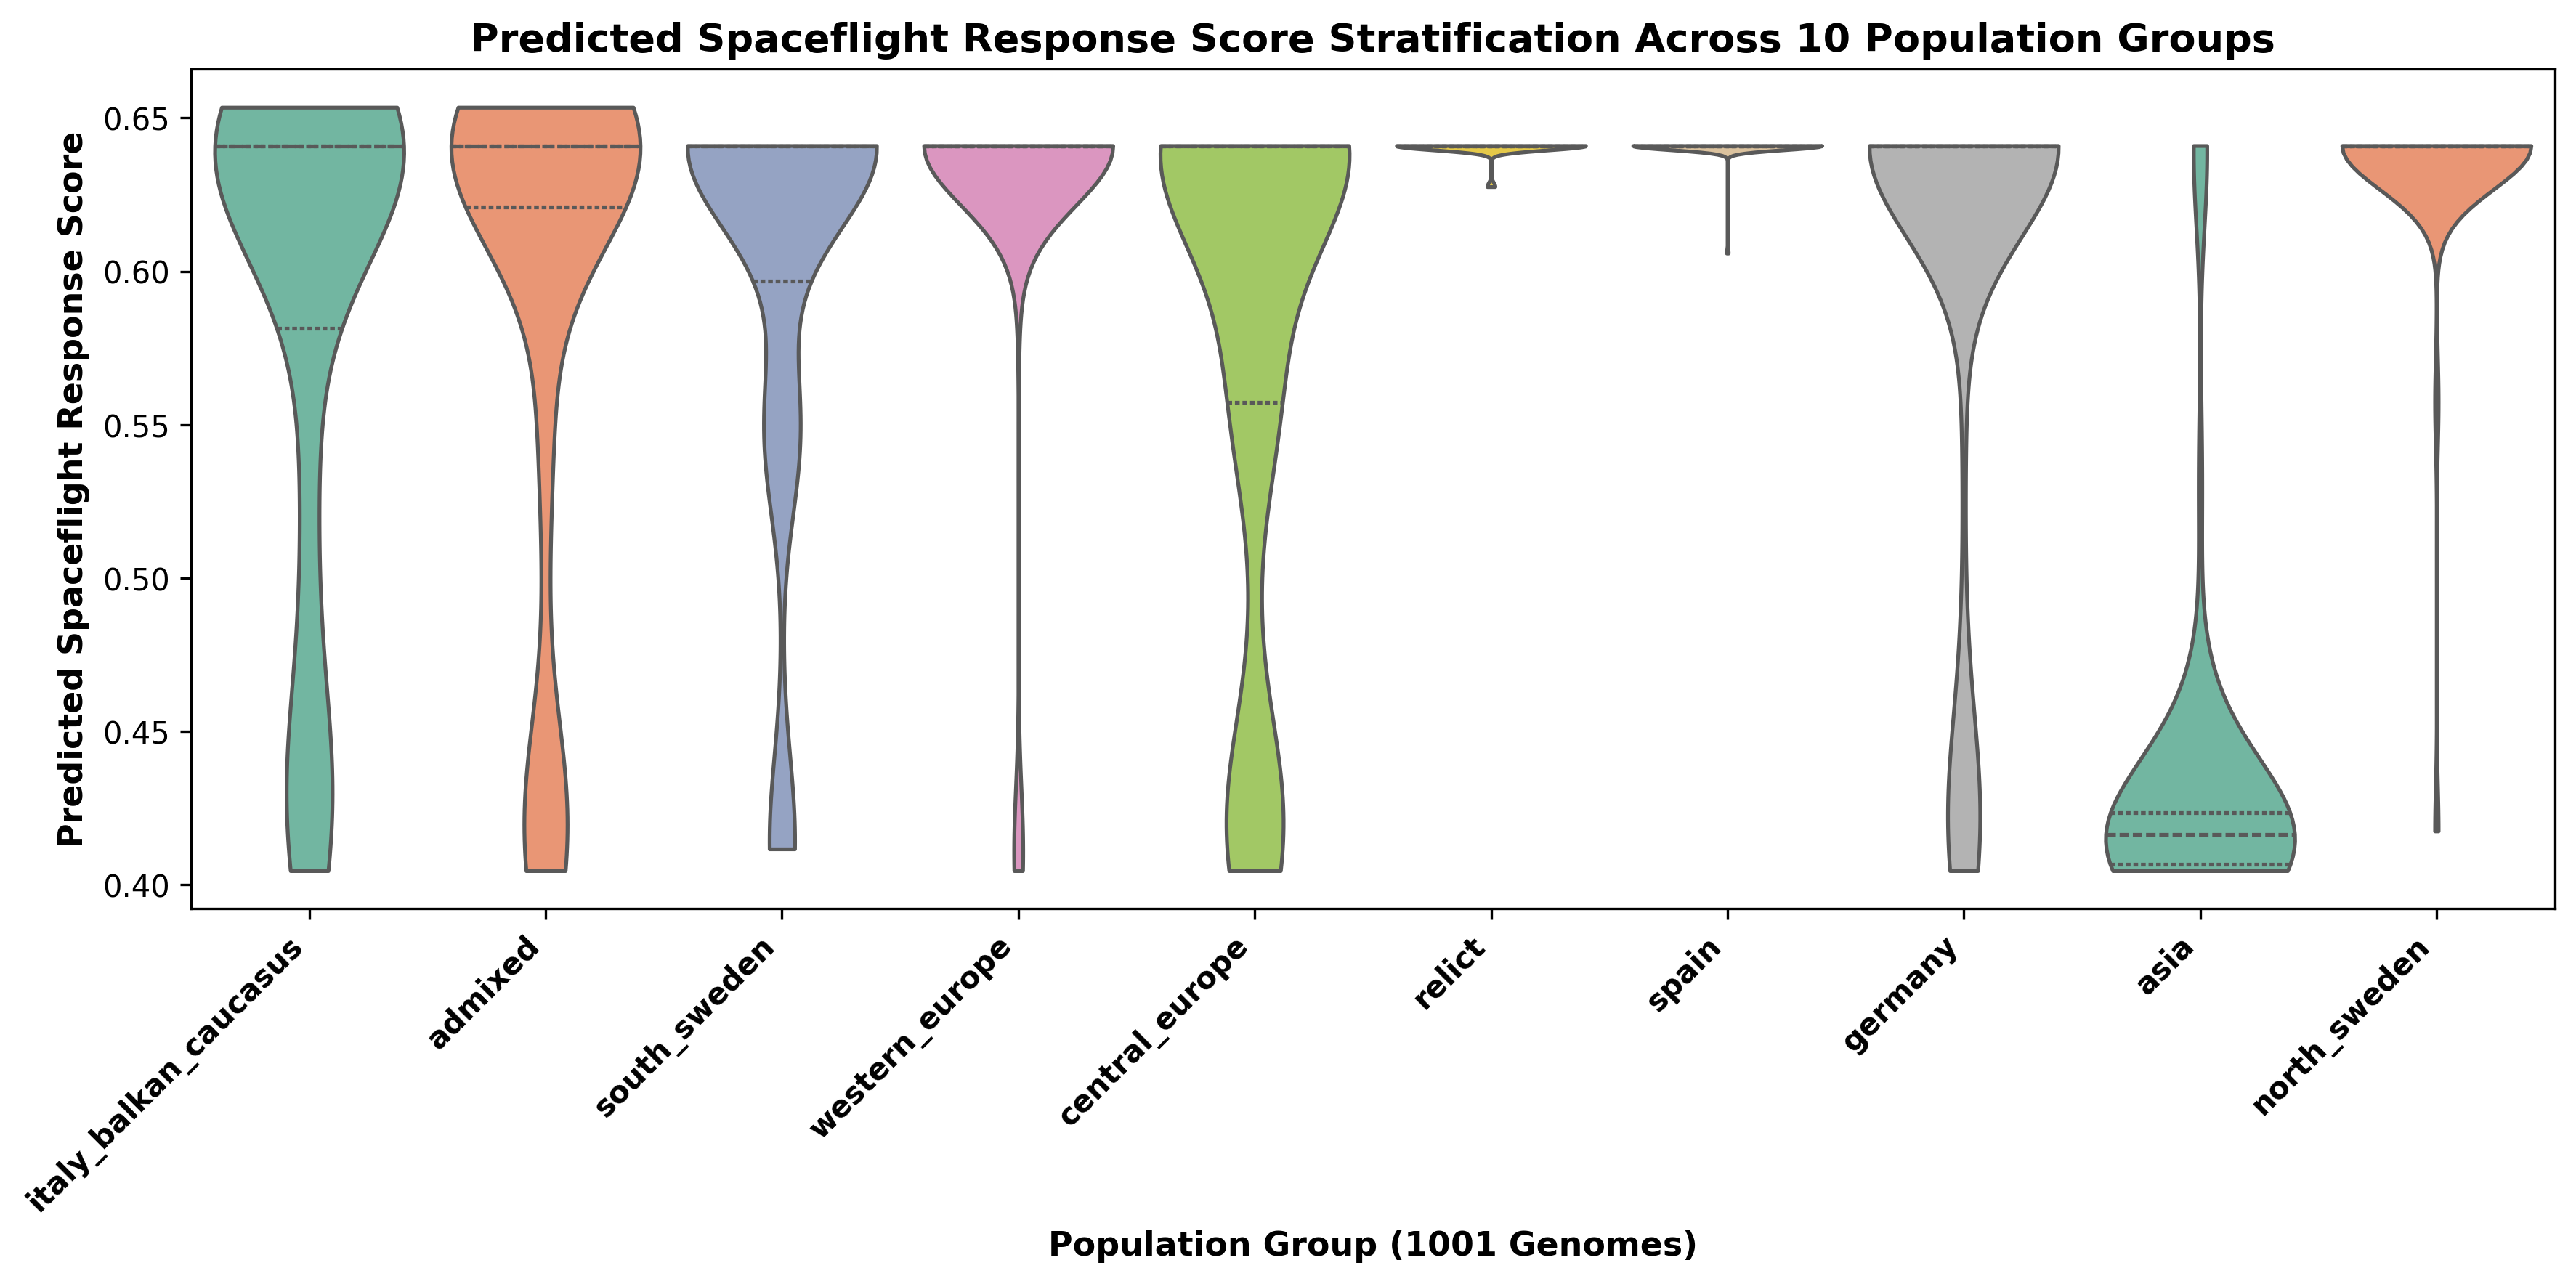
Figure 27: Population Stratification Violin Plots
Distribution of predicted spaceflight response scores across 10 demographic population groups from the 1001 Genomes Project.
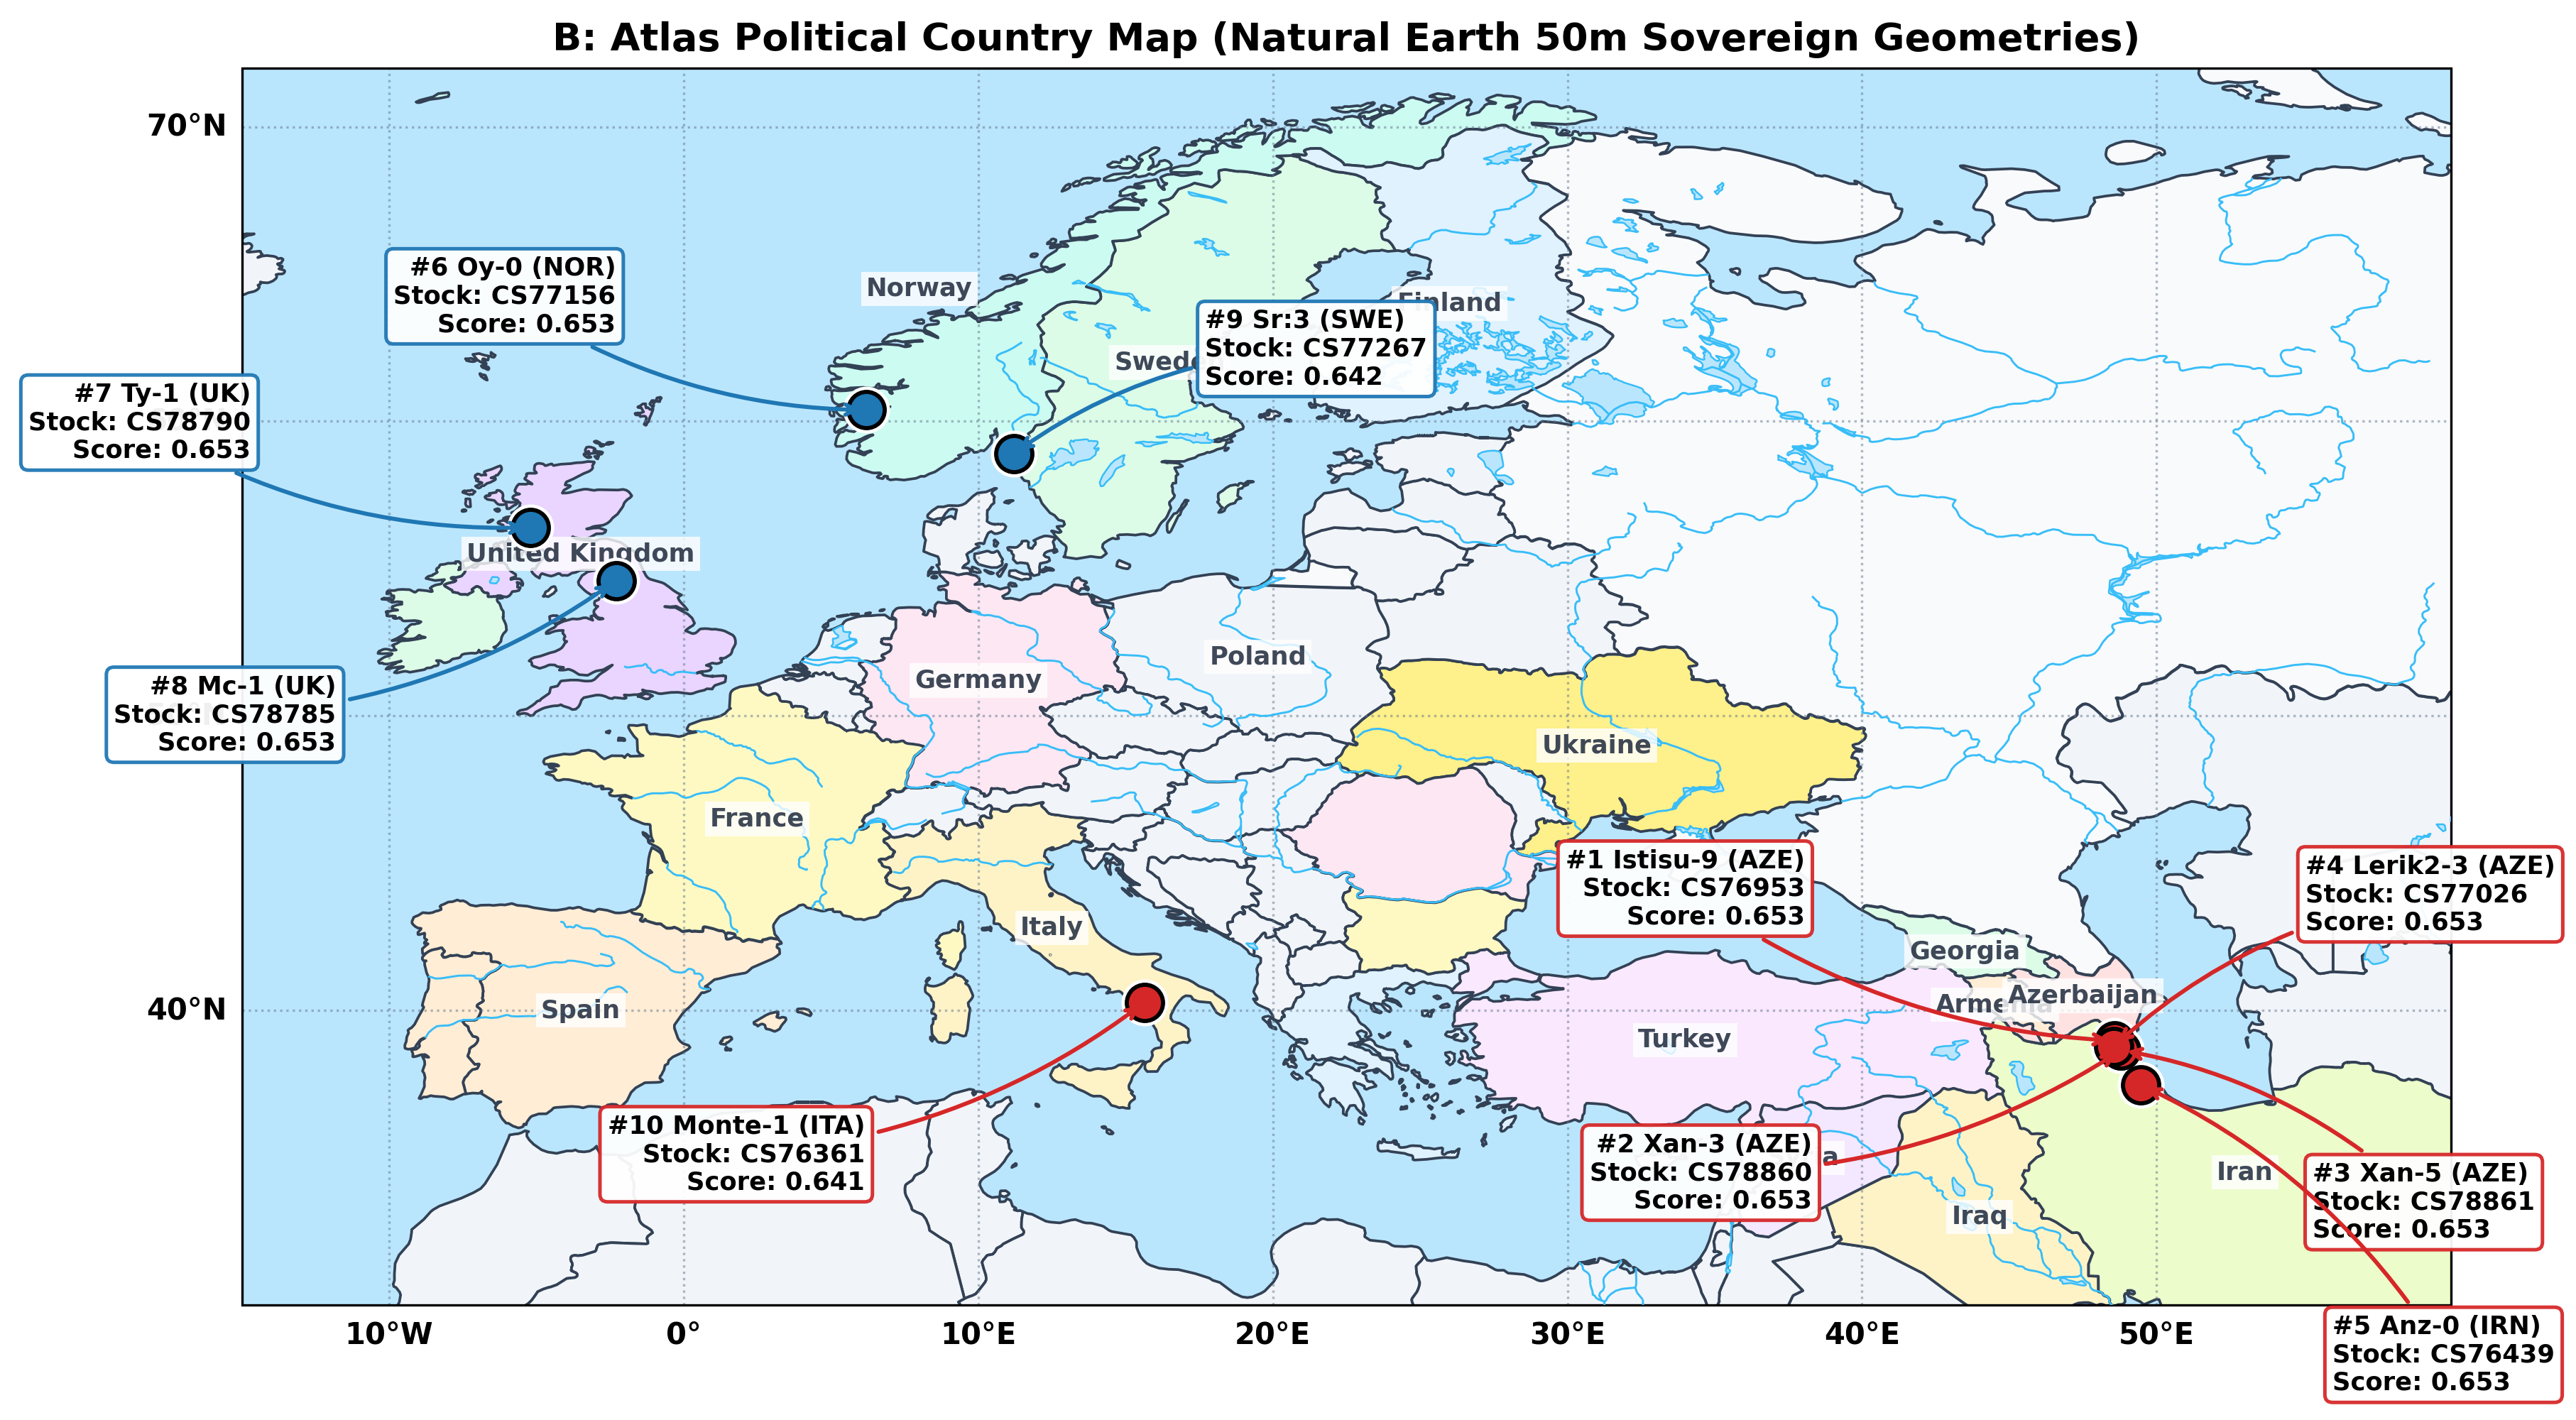
Figure 28: Geographic Origins of the Top 10 Prioritized Accessions
Origins of the top 10 accessions on a Natural Earth 50 m political map, labelled with rank, name, country, ABRC stock number and predicted score (red: Italy/Balkan/Caucasus group; blue: Admixed group). Coordinates are from the 1001 Genomes accession list (tables/top10_predicted_ecotypes.csv). This is panel B of an earlier two-panel figure; panel A, a synthetic terrain illustration, was removed.