Cross-Study Meta-Analysis of Spaceflight Response
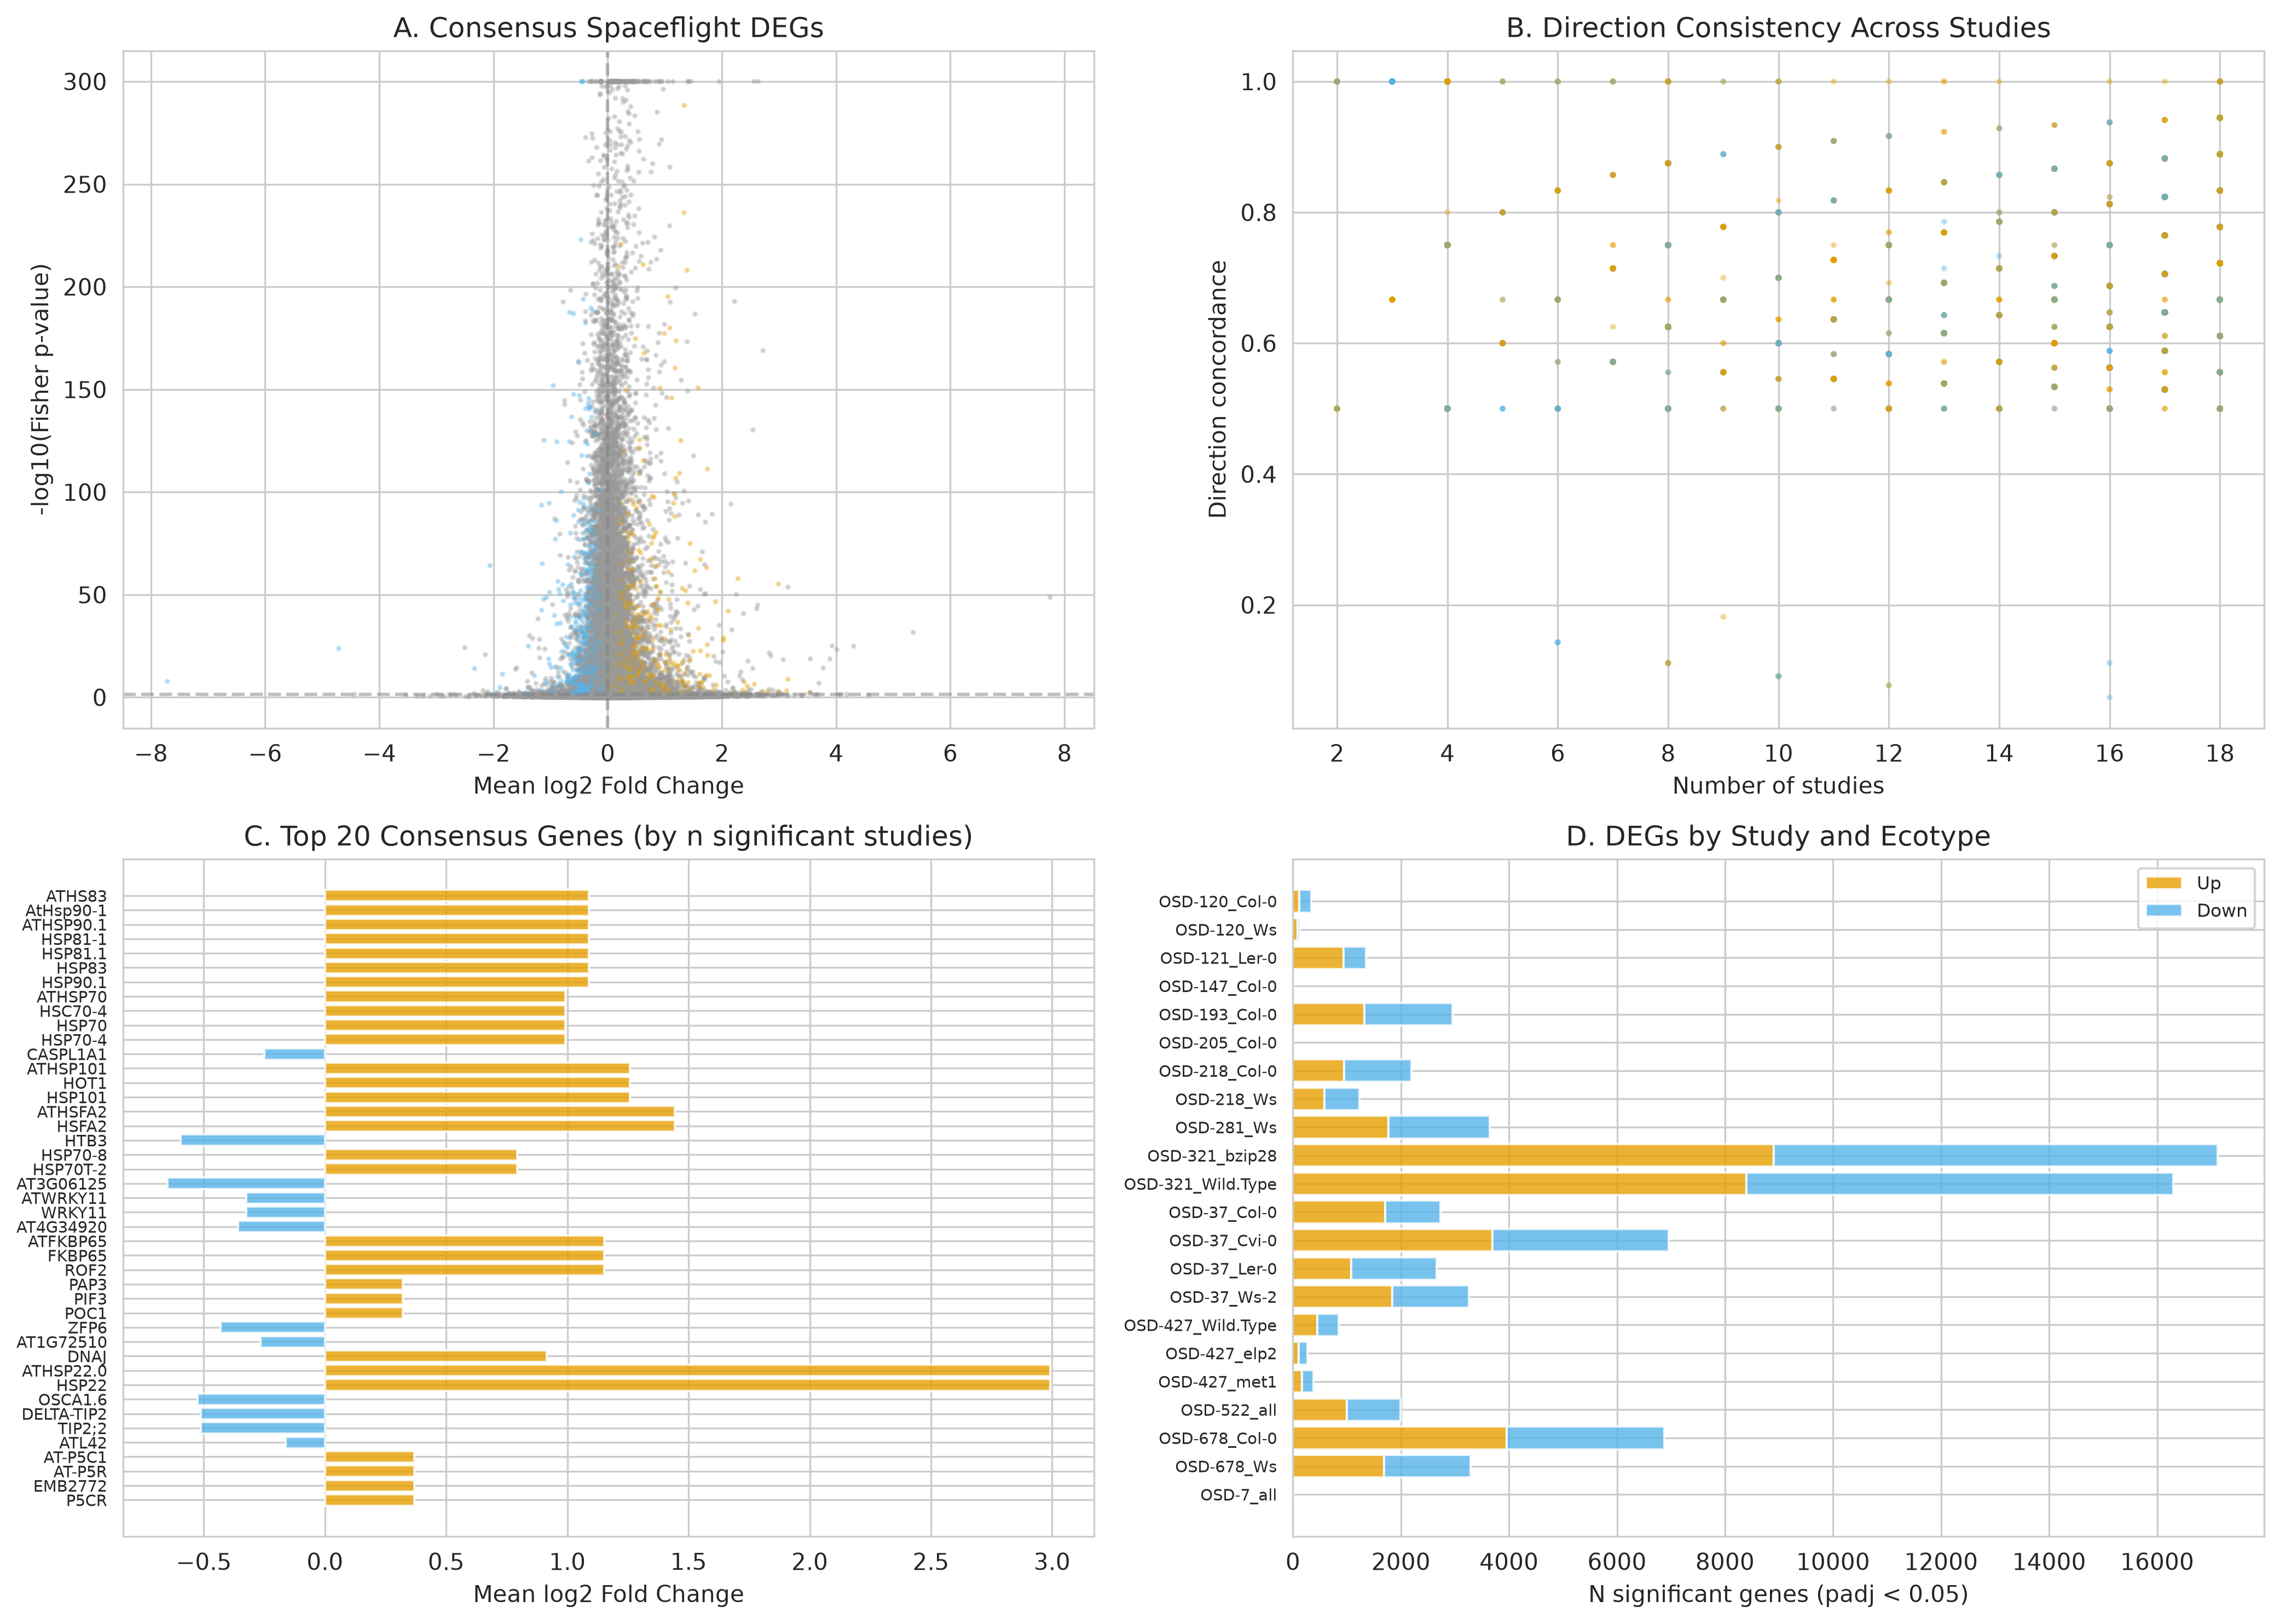
Across 13 NASA GeneLab spaceflight transcriptomics studies (22 ecotype/genotype comparisons; 534,547 gene comparisons), cross-study meta-analysis identified 2,550 consensus significant spaceflight DEGs (1,291 upregulated, 1,259 downregulated; FDR < 0.05 in both Fisher combined p-value and REML random-effects meta-analysis). Five of the 13 studies are continuous-dark BRIC experiments (OSD-37, 121, 147, 205, 321), and 2,429 of the 22,405 Fisher-significant entries are unmapped numeric microarray row identifiers; both are flagged for re-analysis in the manuscript.
AraGWAS Catalog Overlap & Trait Enrichment
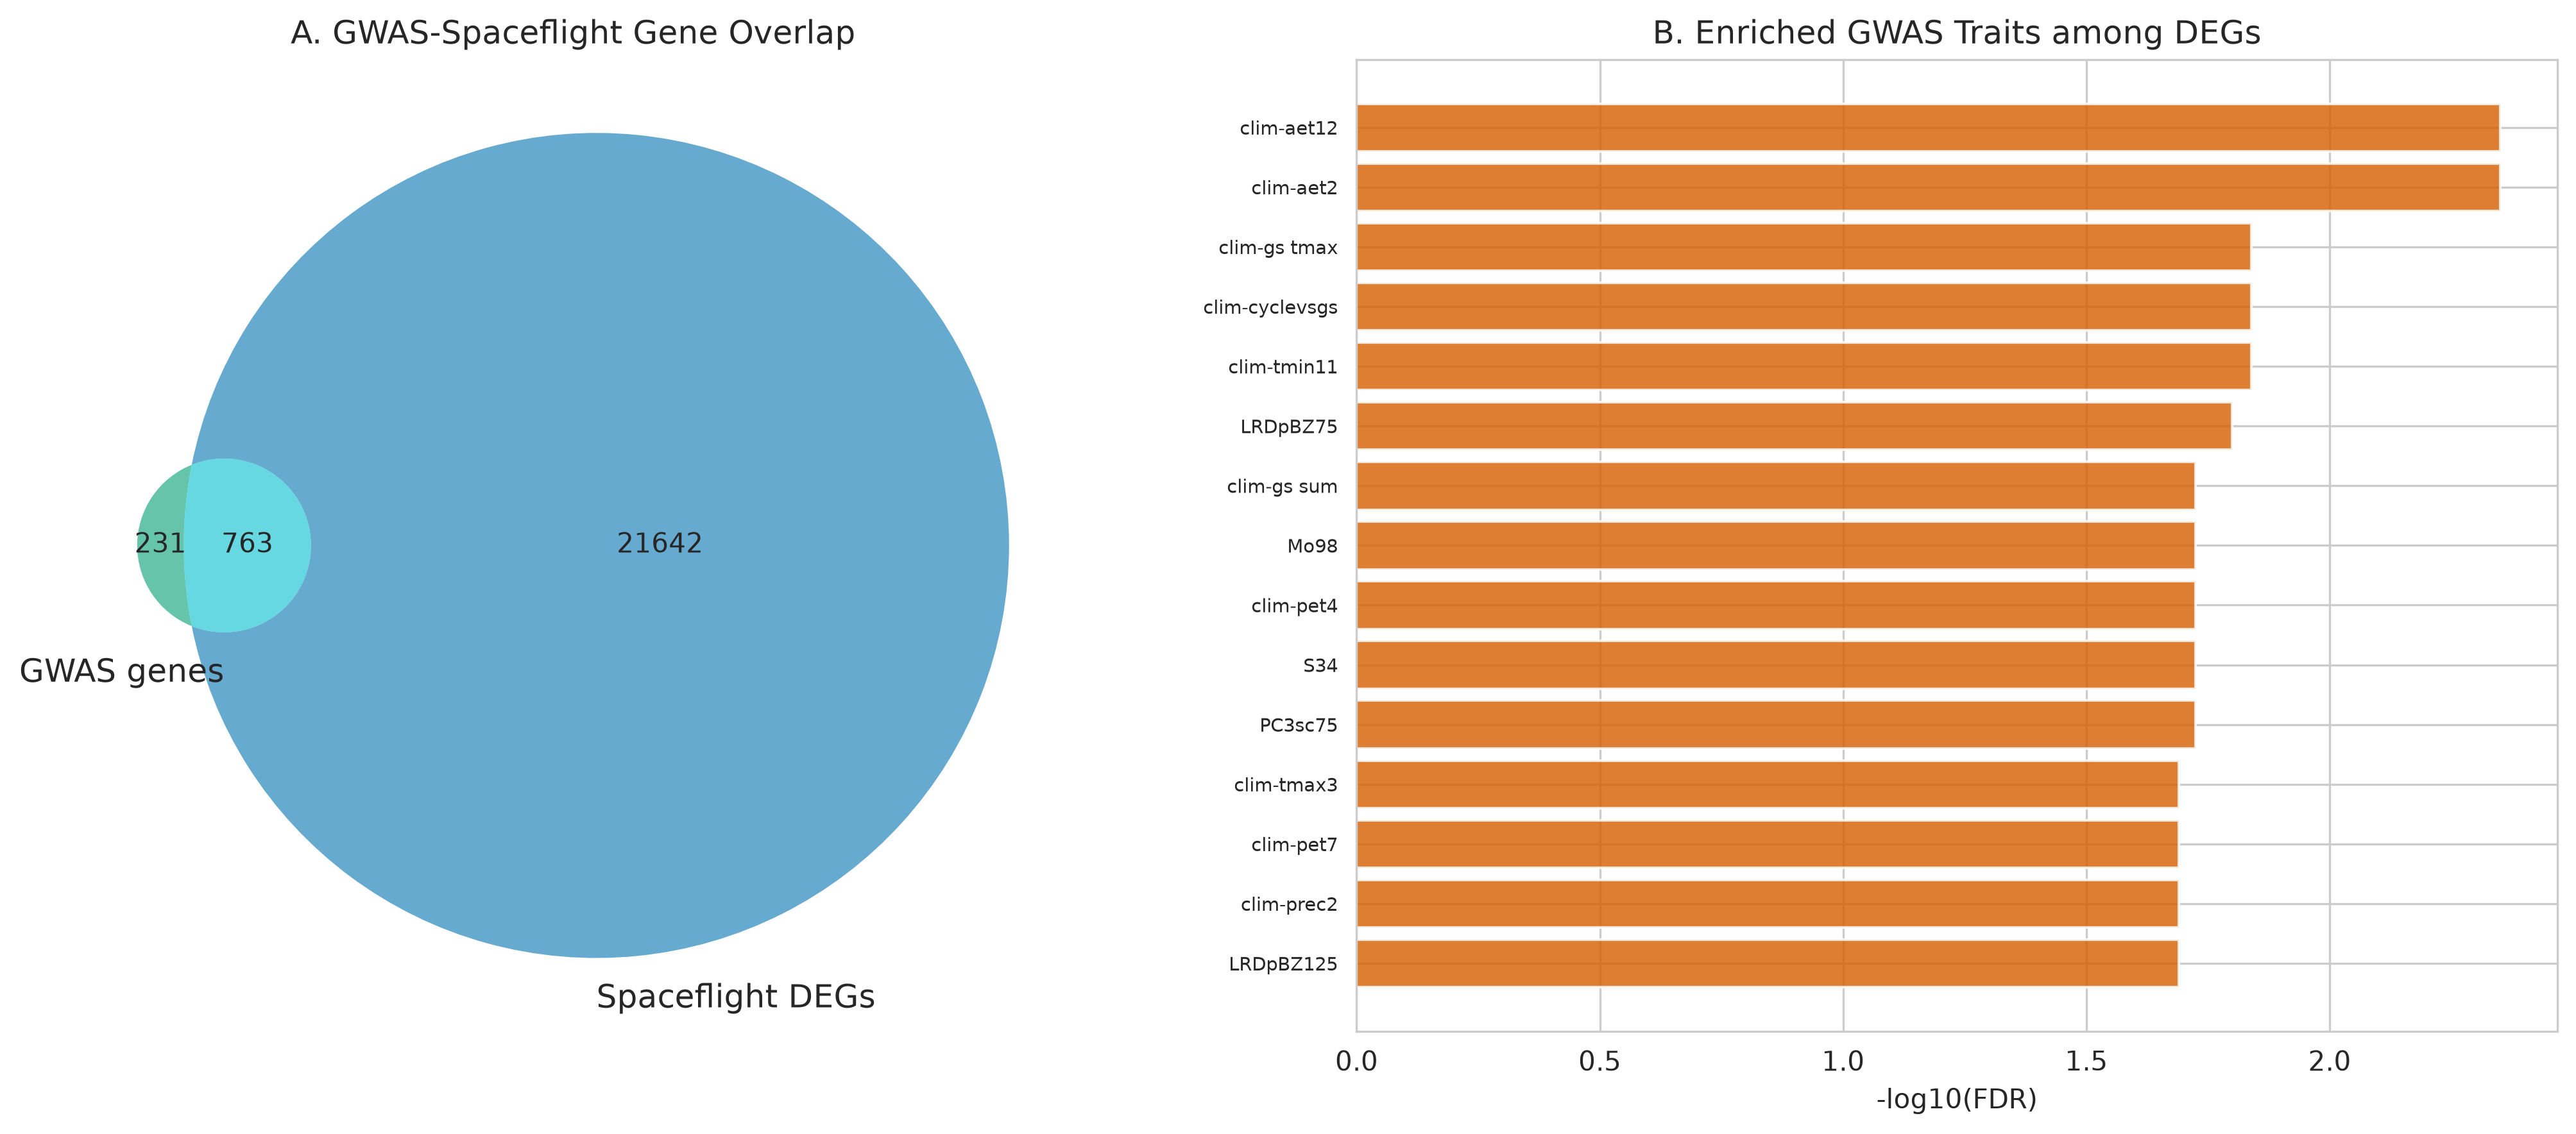
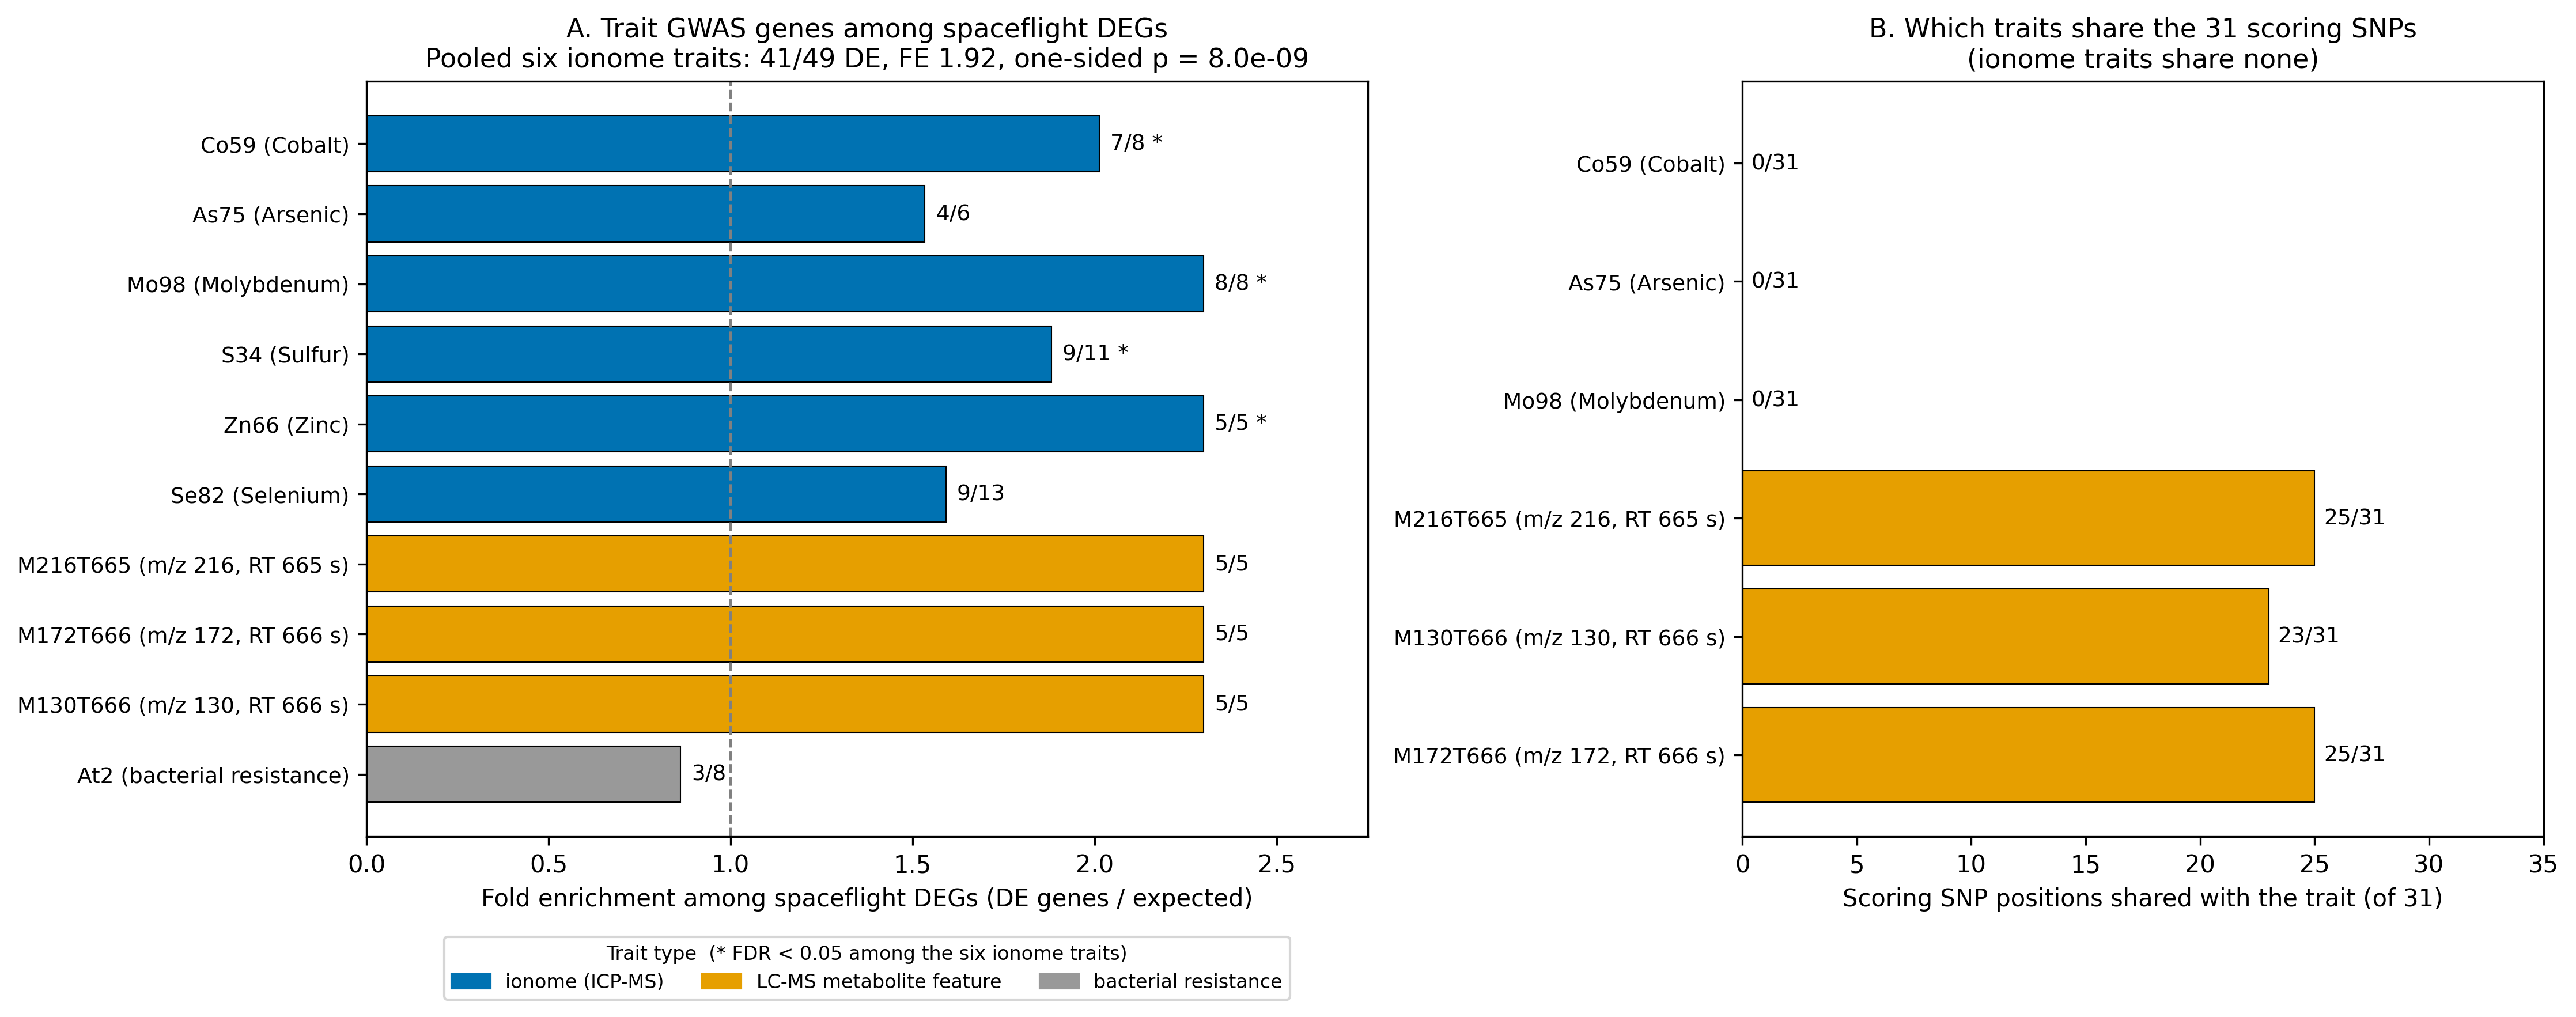
Integrating 462 AraGWAS studies (1,523,262 Bonferroni-significant associations across 279 phenotypes) revealed that GWAS candidate genes are strongly enriched among spaceflight DEGs (763 overlap genes, OR = 4.23, p = 4.45e-102). 90 GWAS phenotypes were significantly enriched, led by climate adaptation and leaf ionome traits (molybdenum, cobalt, sulfur). Pooled over six ionome traits, 41 of 49 genes are differentially expressed (fold enrichment 1.92, one-sided Fisher p = 8.0e-9).
Machine Learning & Ecotype Prediction
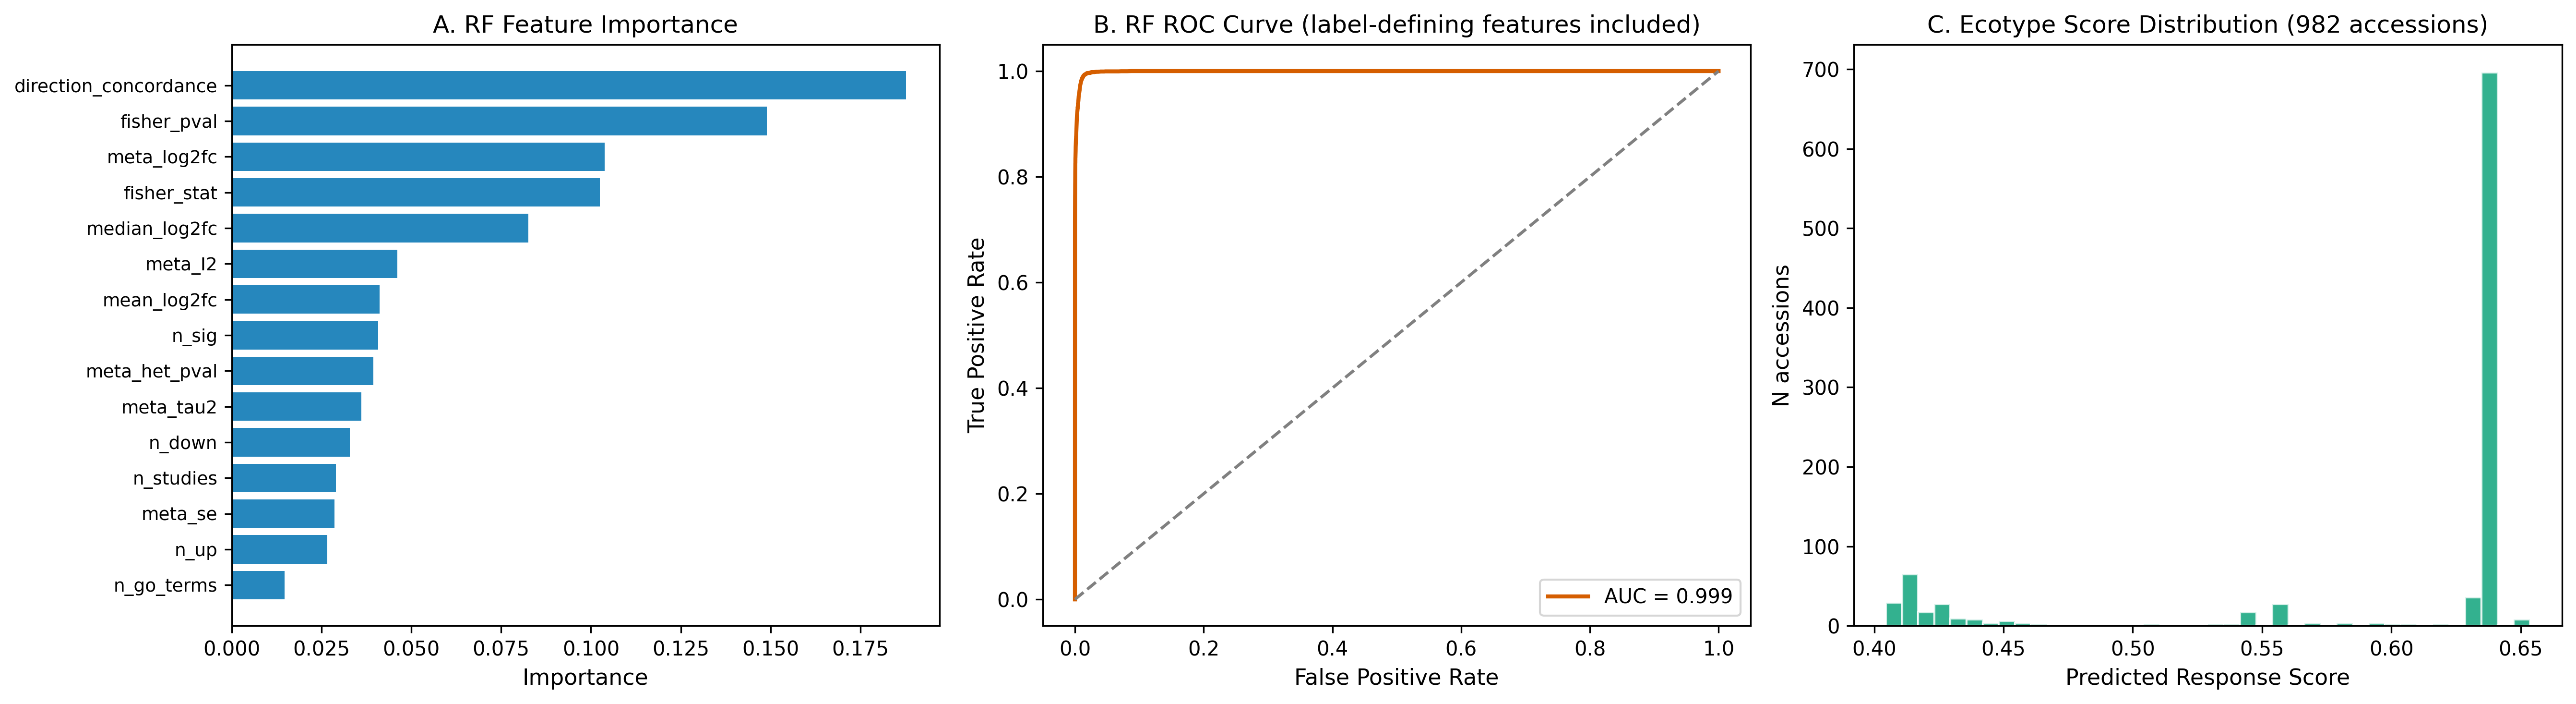
A nested 5-fold cross-validated random forest recovered the consensus labels almost perfectly (AUC = 0.999, average precision = 0.986). Its features include the Fisher and meta-analysis statistics that define those labels, so this reflects recovery of the labelling rule rather than independent predictive performance. Direction concordance across studies (0.188) and Fisher combined p-value (0.149) were the top features.
Top 10 Prioritized Spaceflight-Responsive Accessions
| Rank | Accession | 1001G ID | Stock ID | Origin | Group | Lat / Elev | Chr4 Alt. Hom. SNPs | Score (Percentile) |
|---|---|---|---|---|---|---|---|---|
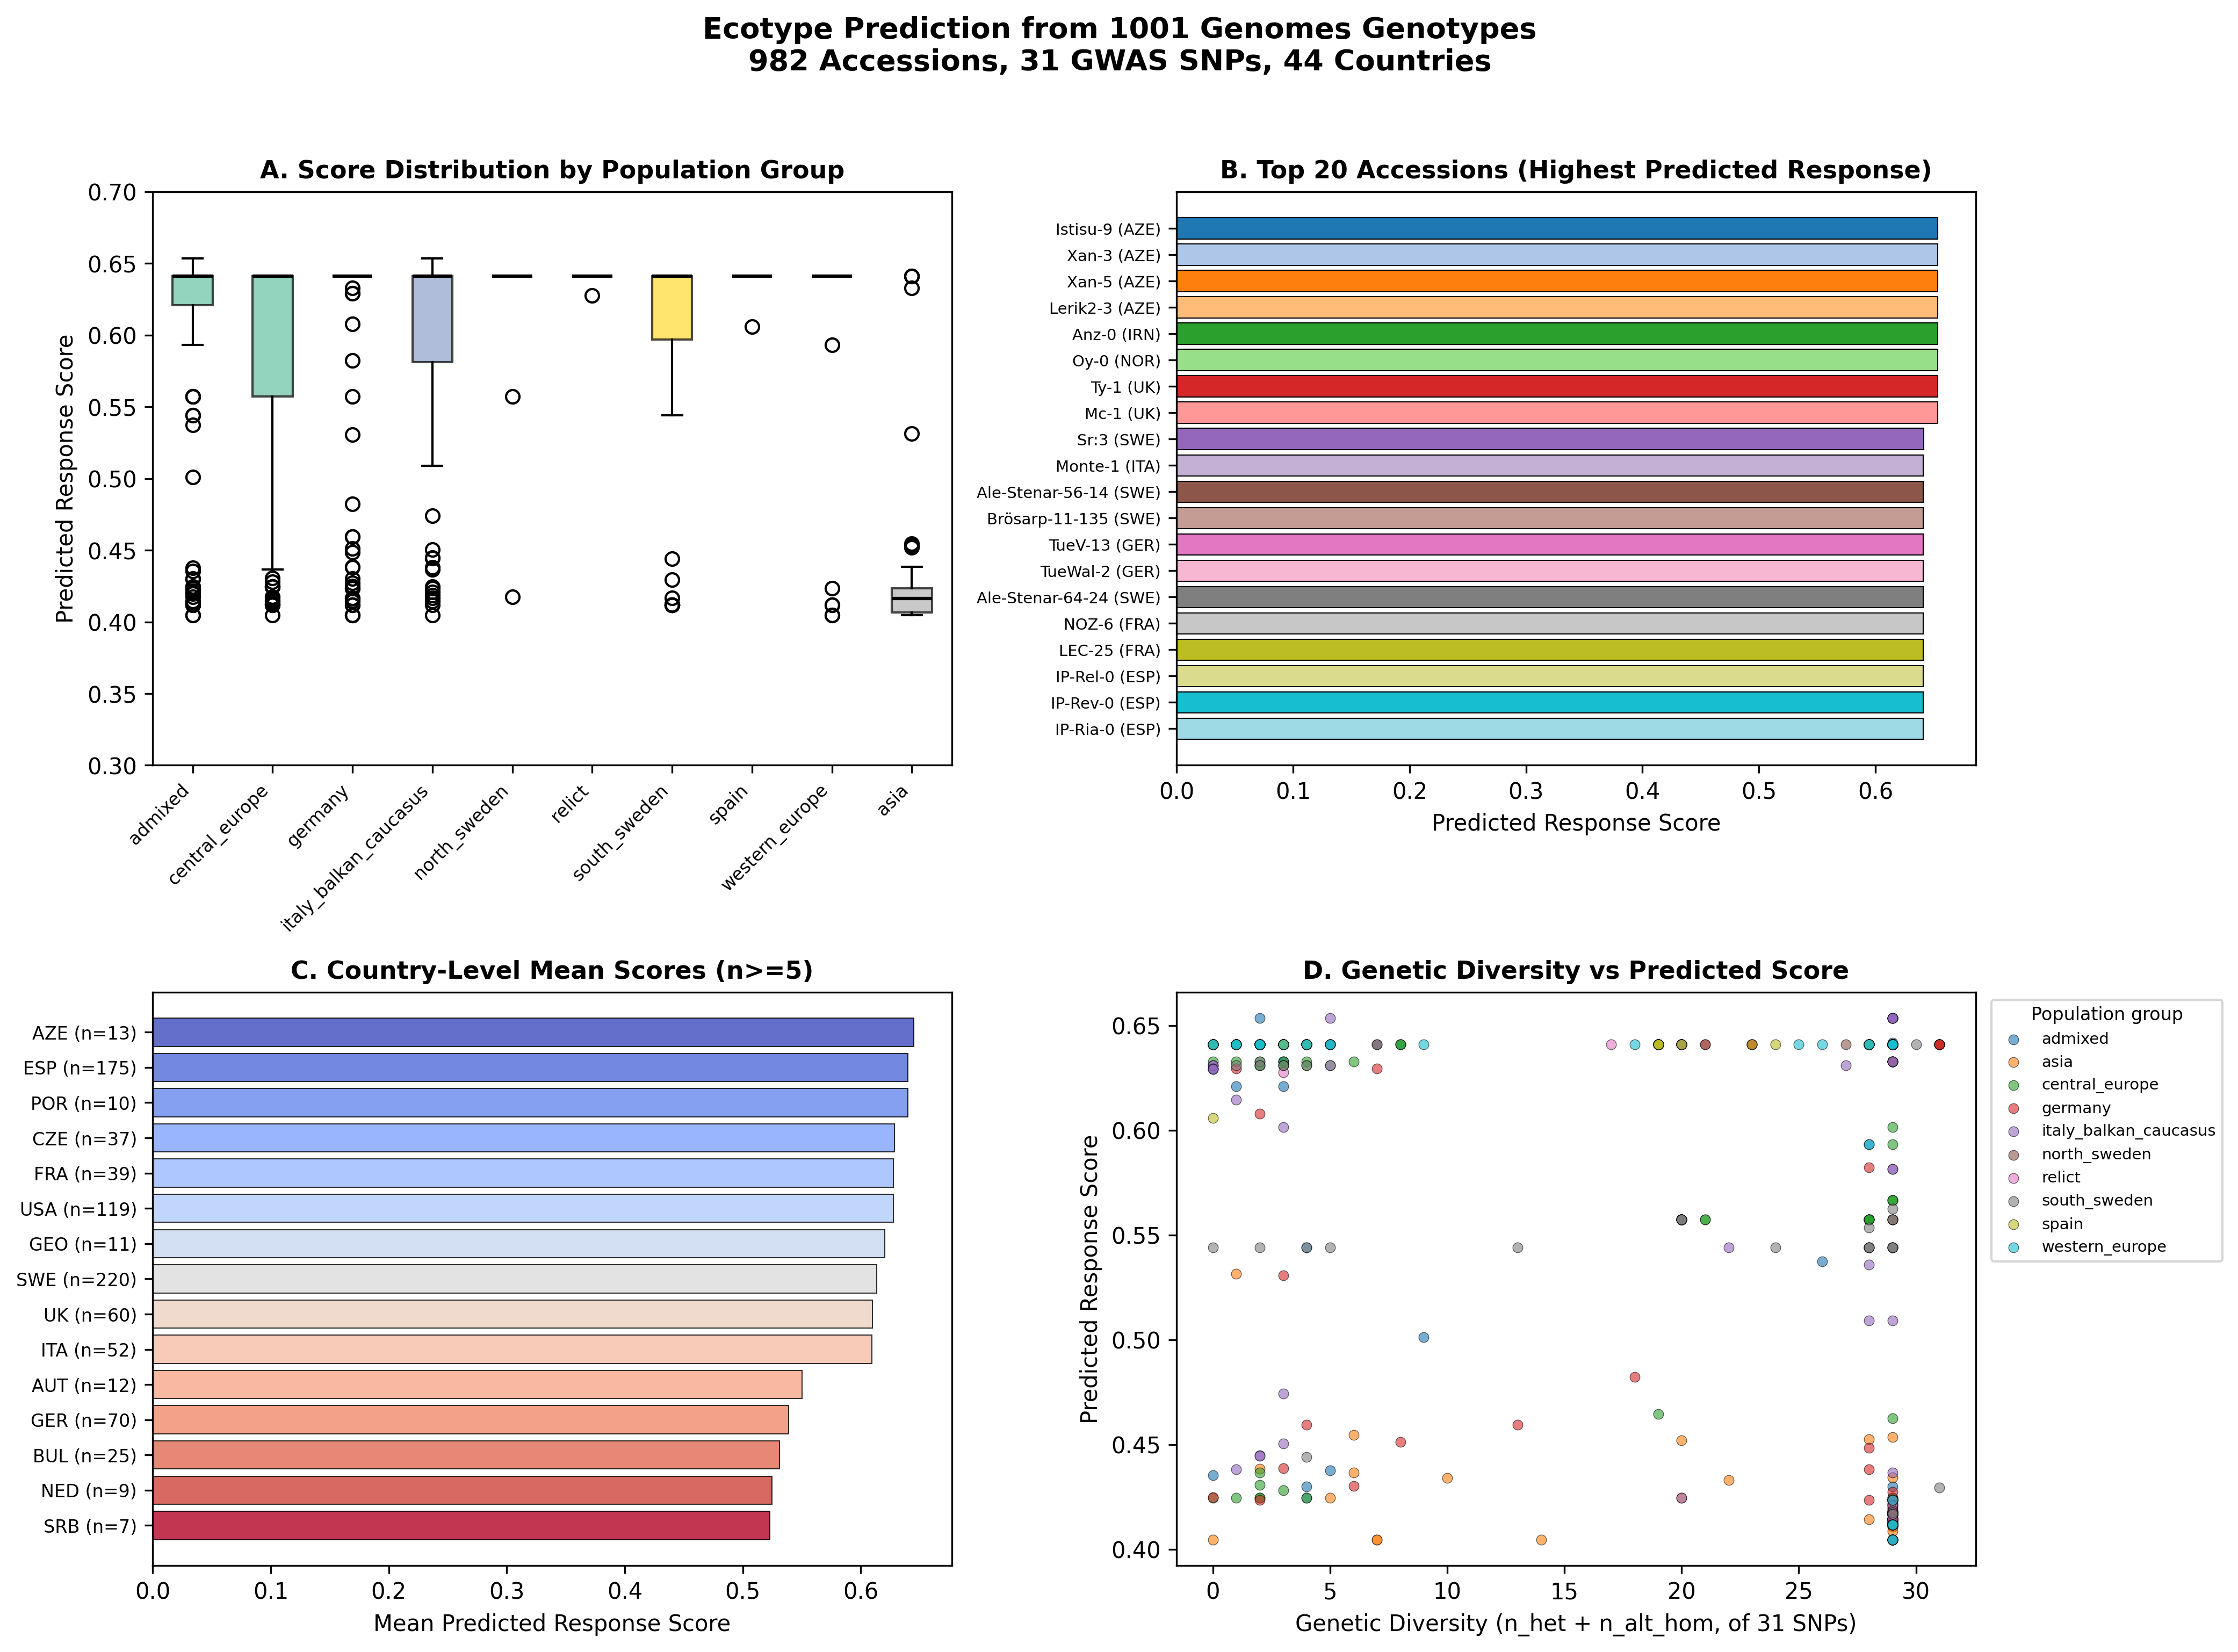
| 1 | Istisu-9 | 9099 | CS76953 | AZE | Italy/Balkan/Caucasus | 38.98°N / 101m | 29 / 29 SNPs | 0.653 (99.6%) |
| 2 | Xan-3 | 9067 | CS78860 | AZE | Italy/Balkan/Caucasus | 38.65°N / 20m | 29 / 29 SNPs | 0.653 (99.6%) |
| 3 | Xan-5 | 9069 | CS78861 | AZE | Italy/Balkan/Caucasus | 38.65°N / 20m | 5 / 29 SNPs | 0.653 (99.6%) |
| 4 | Lerik2-3 | 9081 | CS77026 | AZE | Italy/Balkan/Caucasus | 38.78°N / 413m | 29 / 29 SNPs | 0.653 (99.6%) |
| 5 | Anz-0 | 9759 | CS76439 | IRN | Italy/Balkan/Caucasus | 37.47°N / -23m | 29 / 29 SNPs | 0.653 (99.6%) |
| 6 | Oy-0 | 7288 | CS77156 | NOR | Admixed | 60.39°N / 49m | 29 / 29 SNPs | 0.653 (99.6%) |
| 7 | Ty-1 | 5784 | CS78790 | UK | Admixed | 56.40°N / 153m | 29 / 29 SNPs | 0.653 (99.6%) |
| 8 | Mc-1 | 5757 | CS78785 | UK | Admixed | 54.60°N / 596m | 2 / 29 SNPs | 0.653 (99.6%) |
| 9 | Sr:3 | 6086 | CS77267 | SWE | Admixed | 58.90°N / 17m | 29 / 29 SNPs | 0.642 (99.2%) |
| 10 | Monte-1 | 9966 | CS76361 | ITA | Italy/Balkan/Caucasus | 40.28°N / 485m | 29 / 29 SNPs | 0.641 (99.0%) |
Geographic Distribution & Latitudinal Gradients
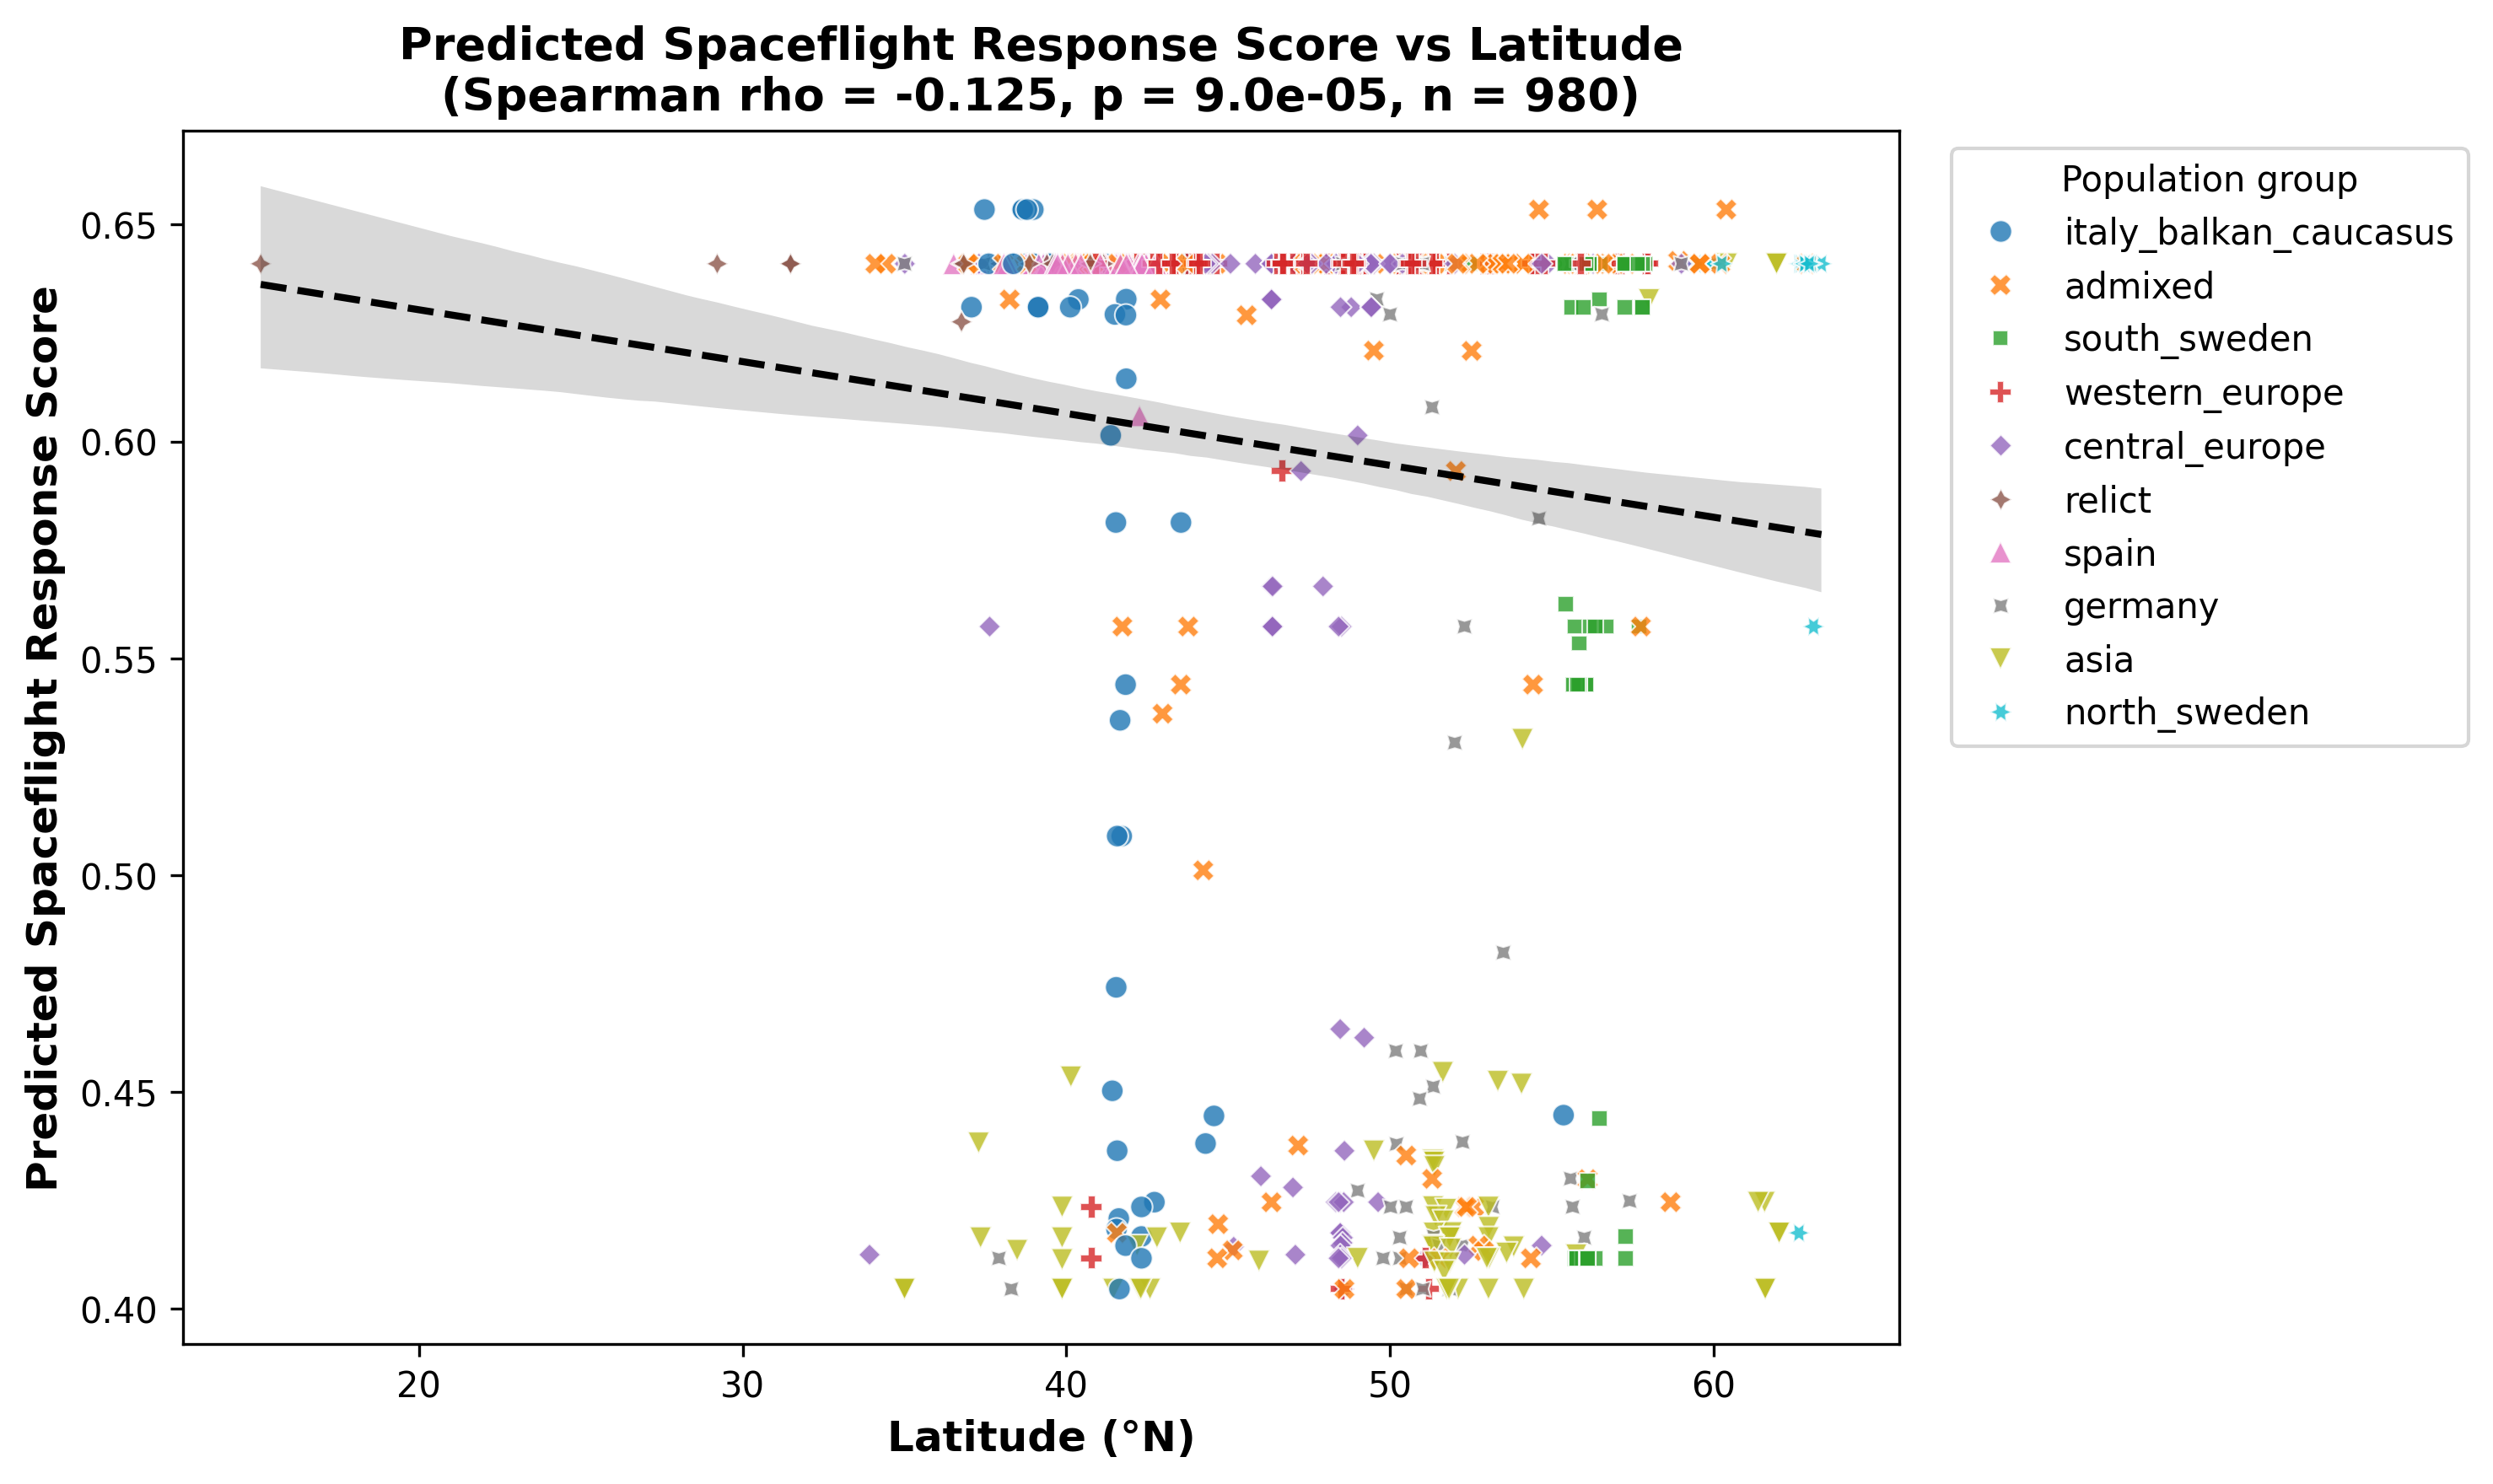
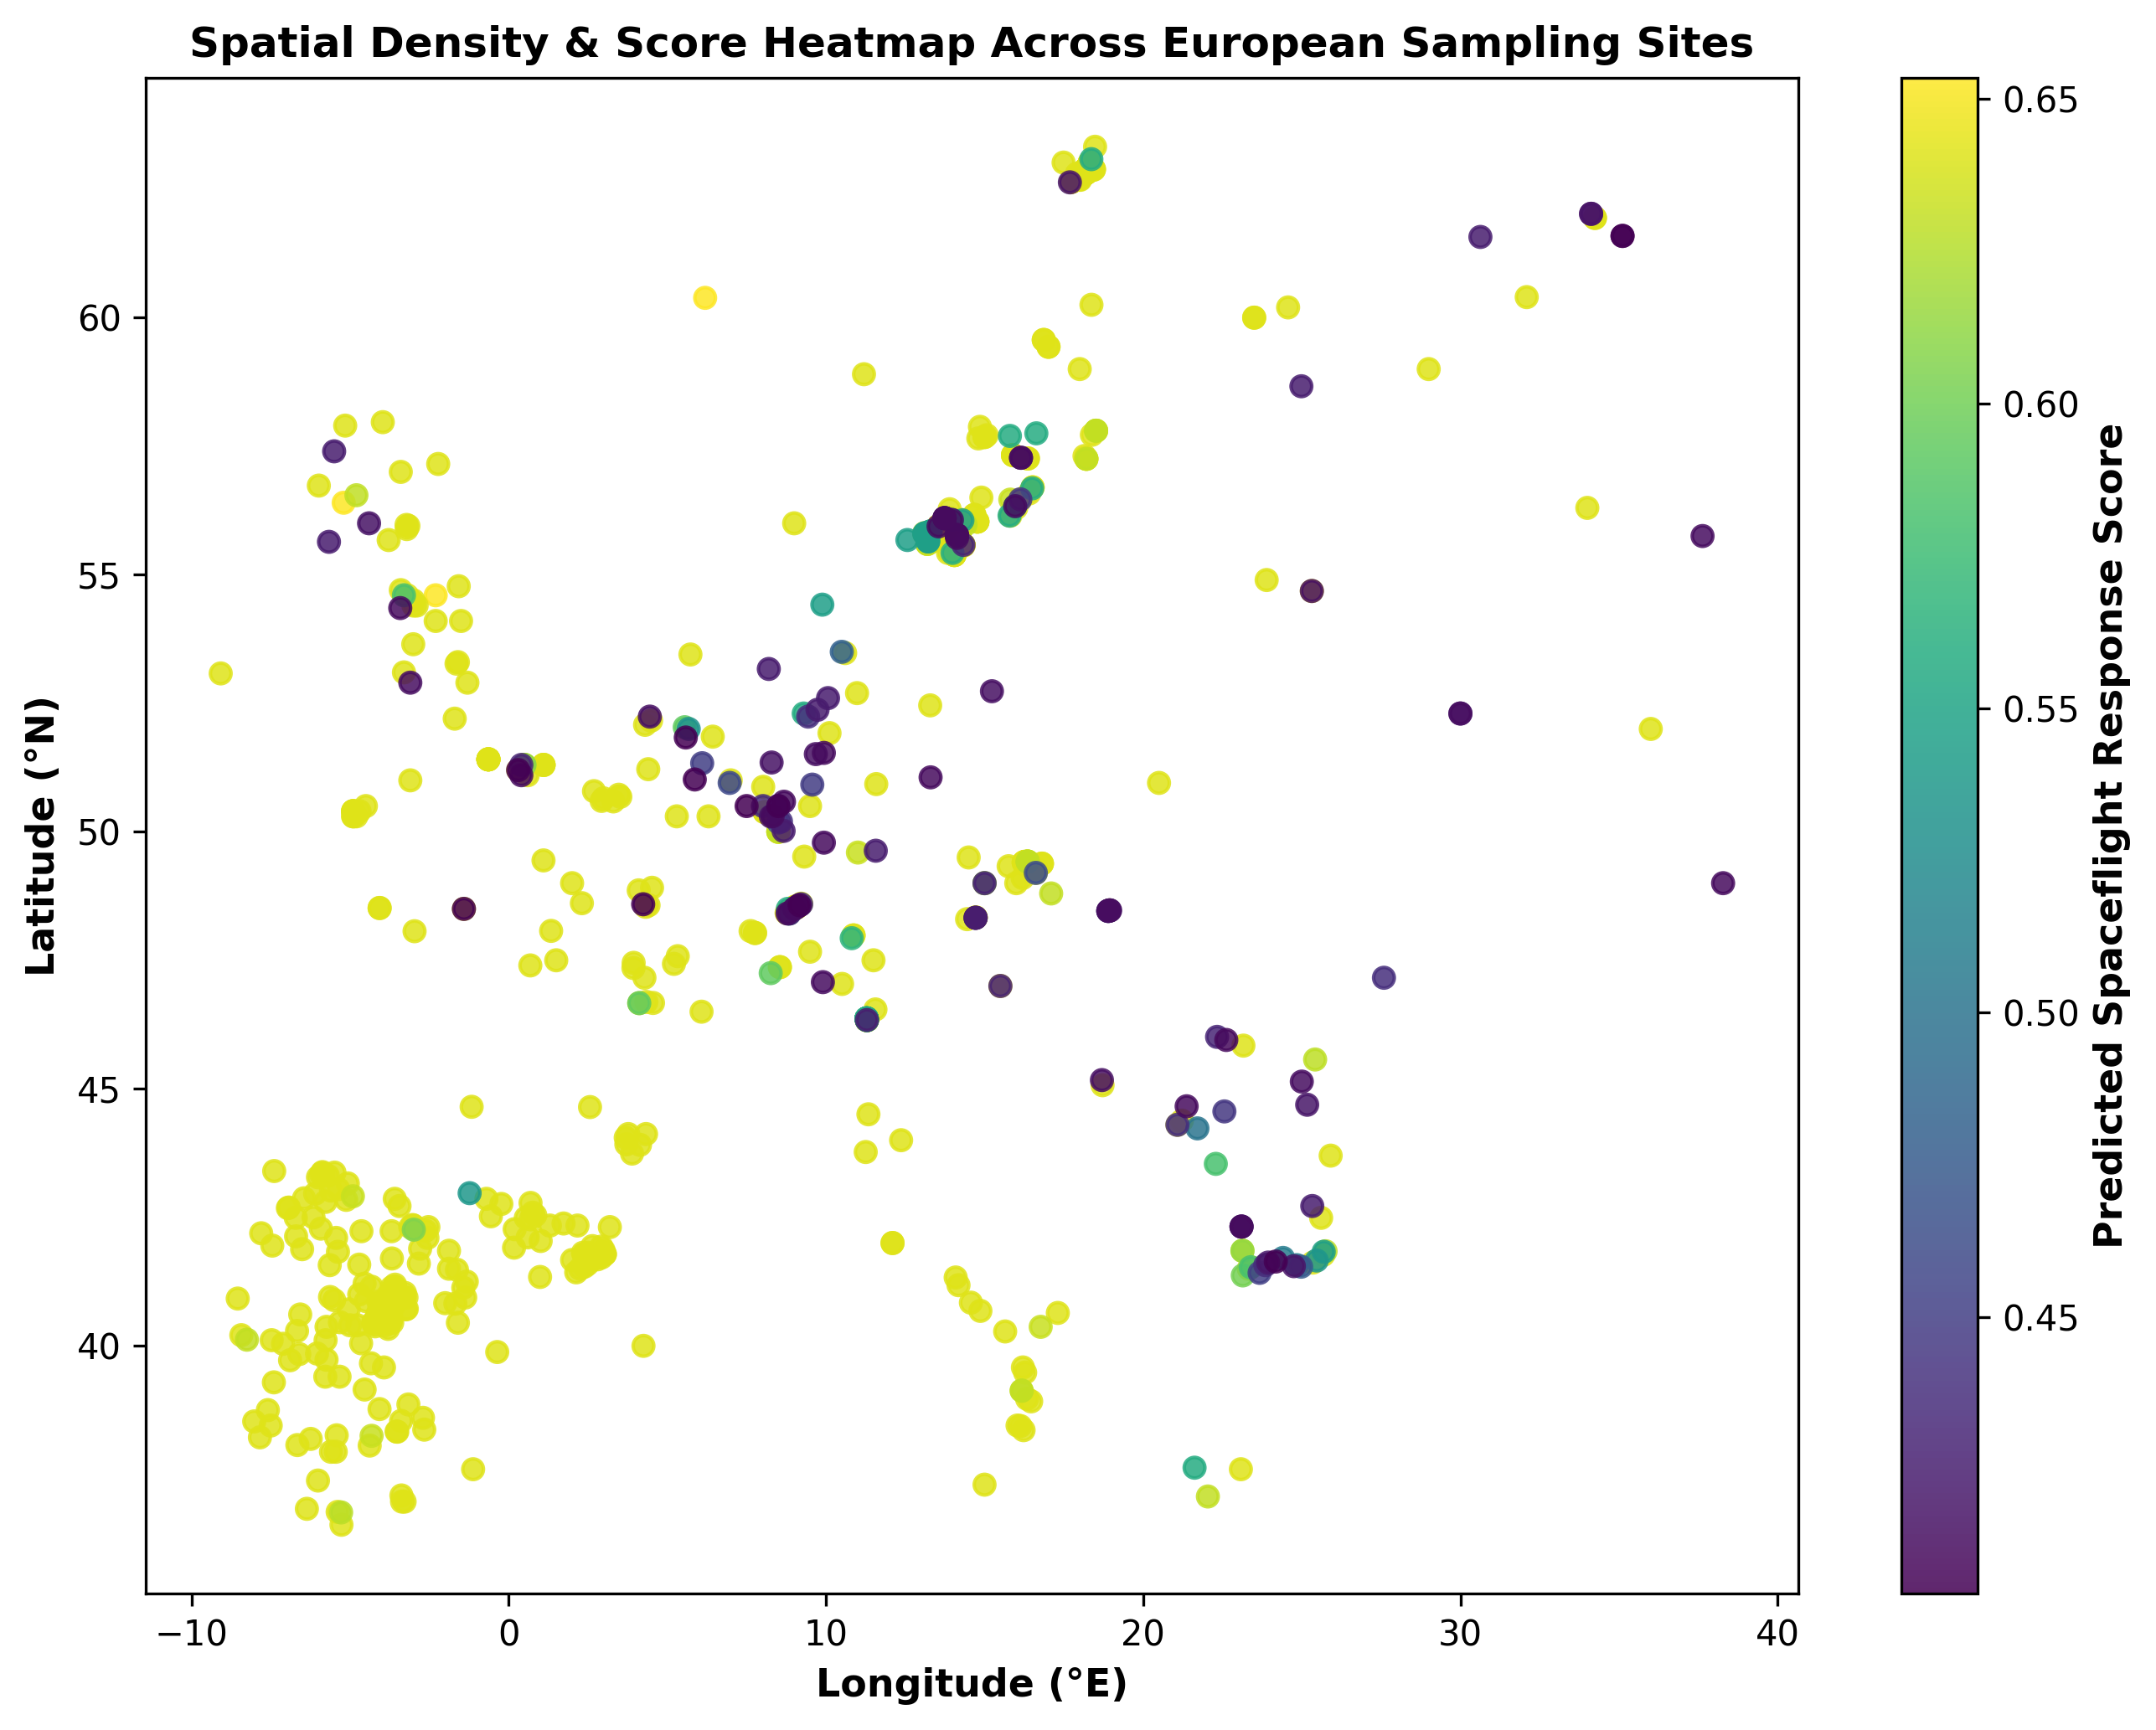
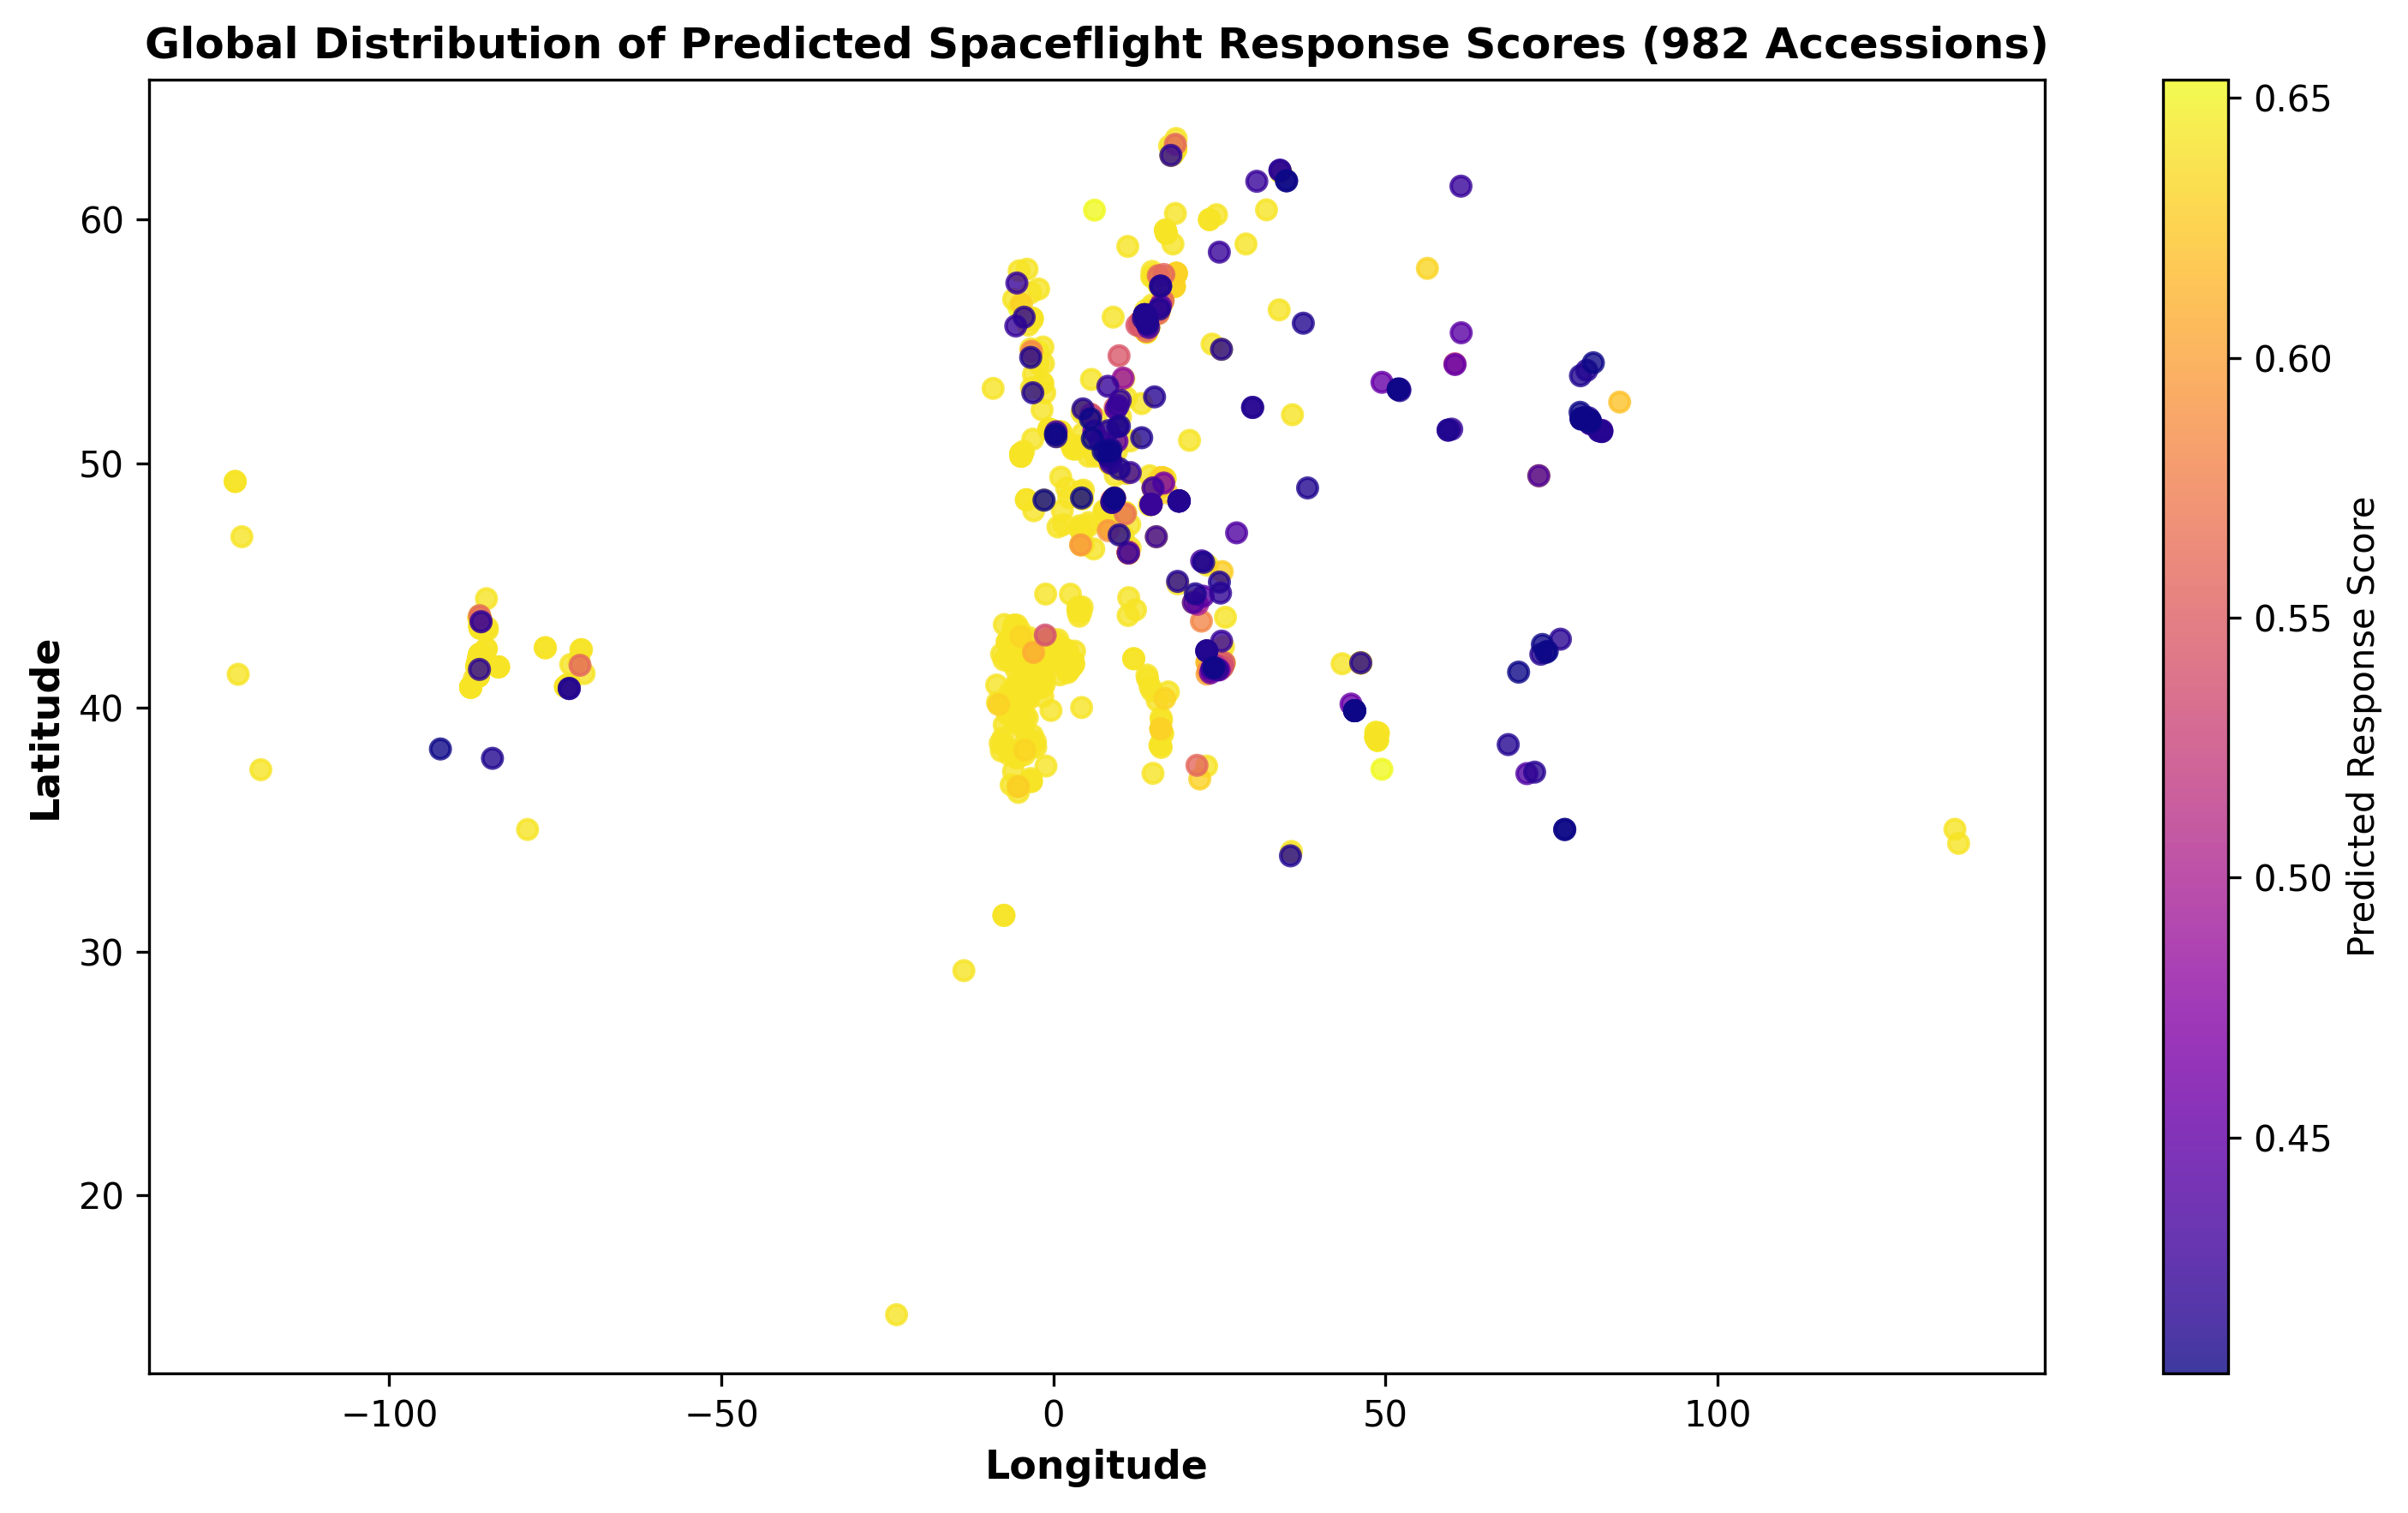
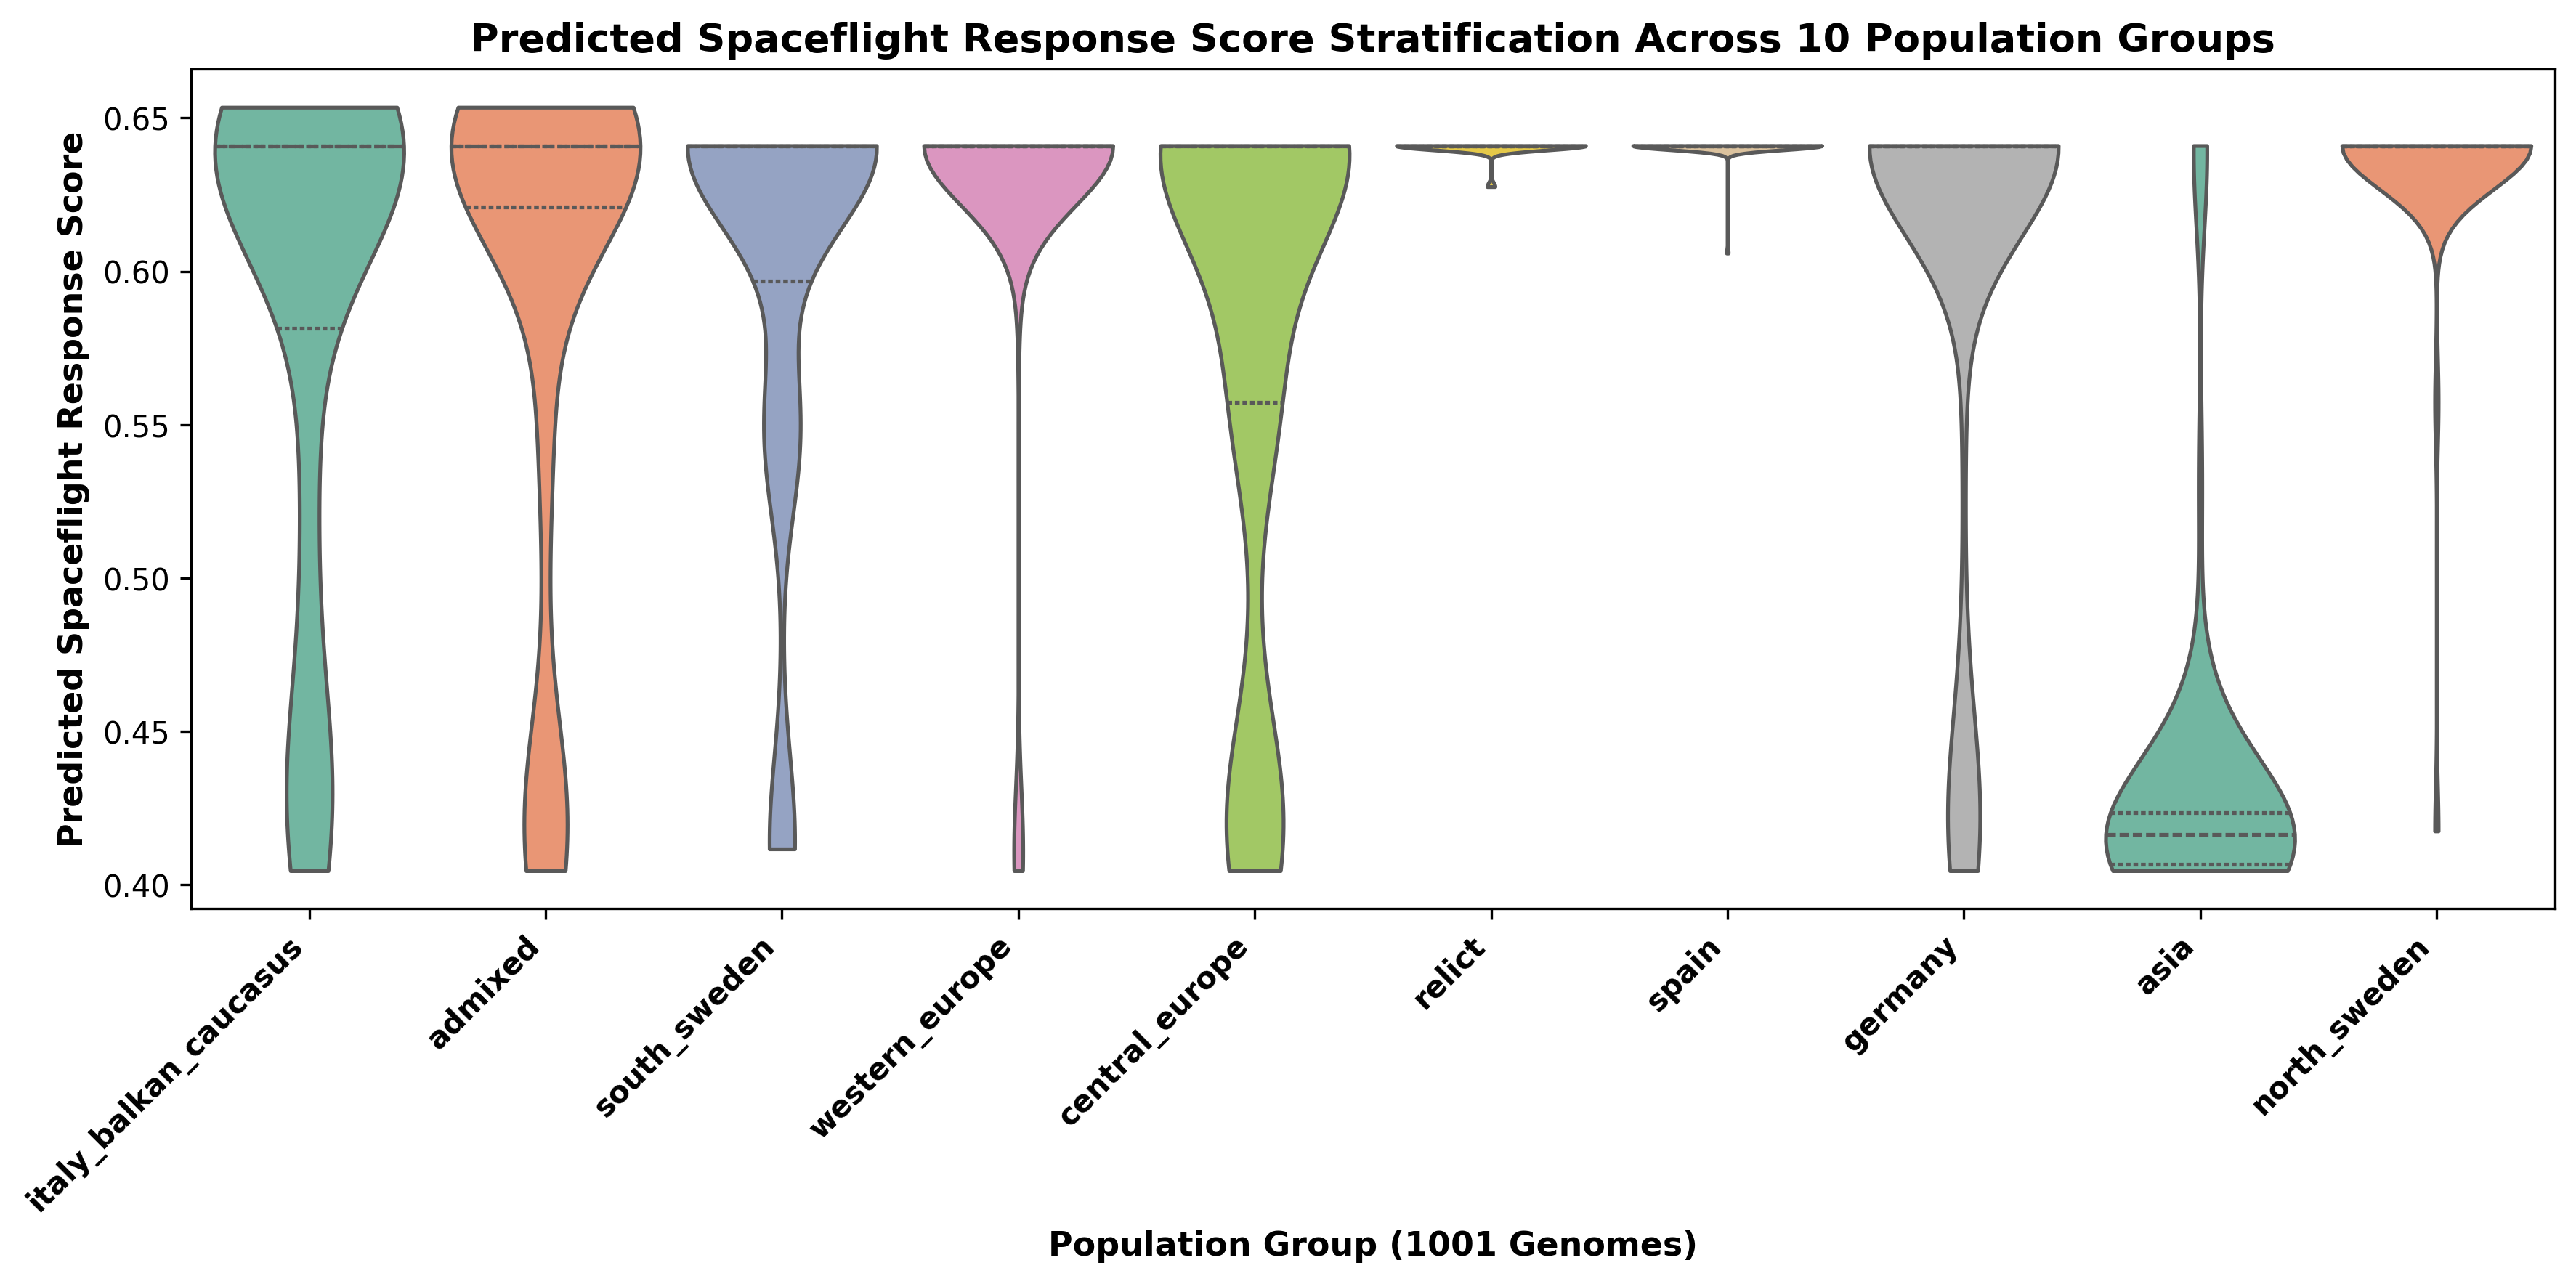
Mapping 982 accessions from the 1001 Genomes Project demonstrated a significant latitudinal gradient (Spearman ρ = -0.125, p = 8.97e-5), while elevation showed a weak non-significant trend (ρ = -0.047). A regression on population group, latitude and elevation explained 34.9% of predicted score variance (R² = 0.349).
Chromosome 4 Locus
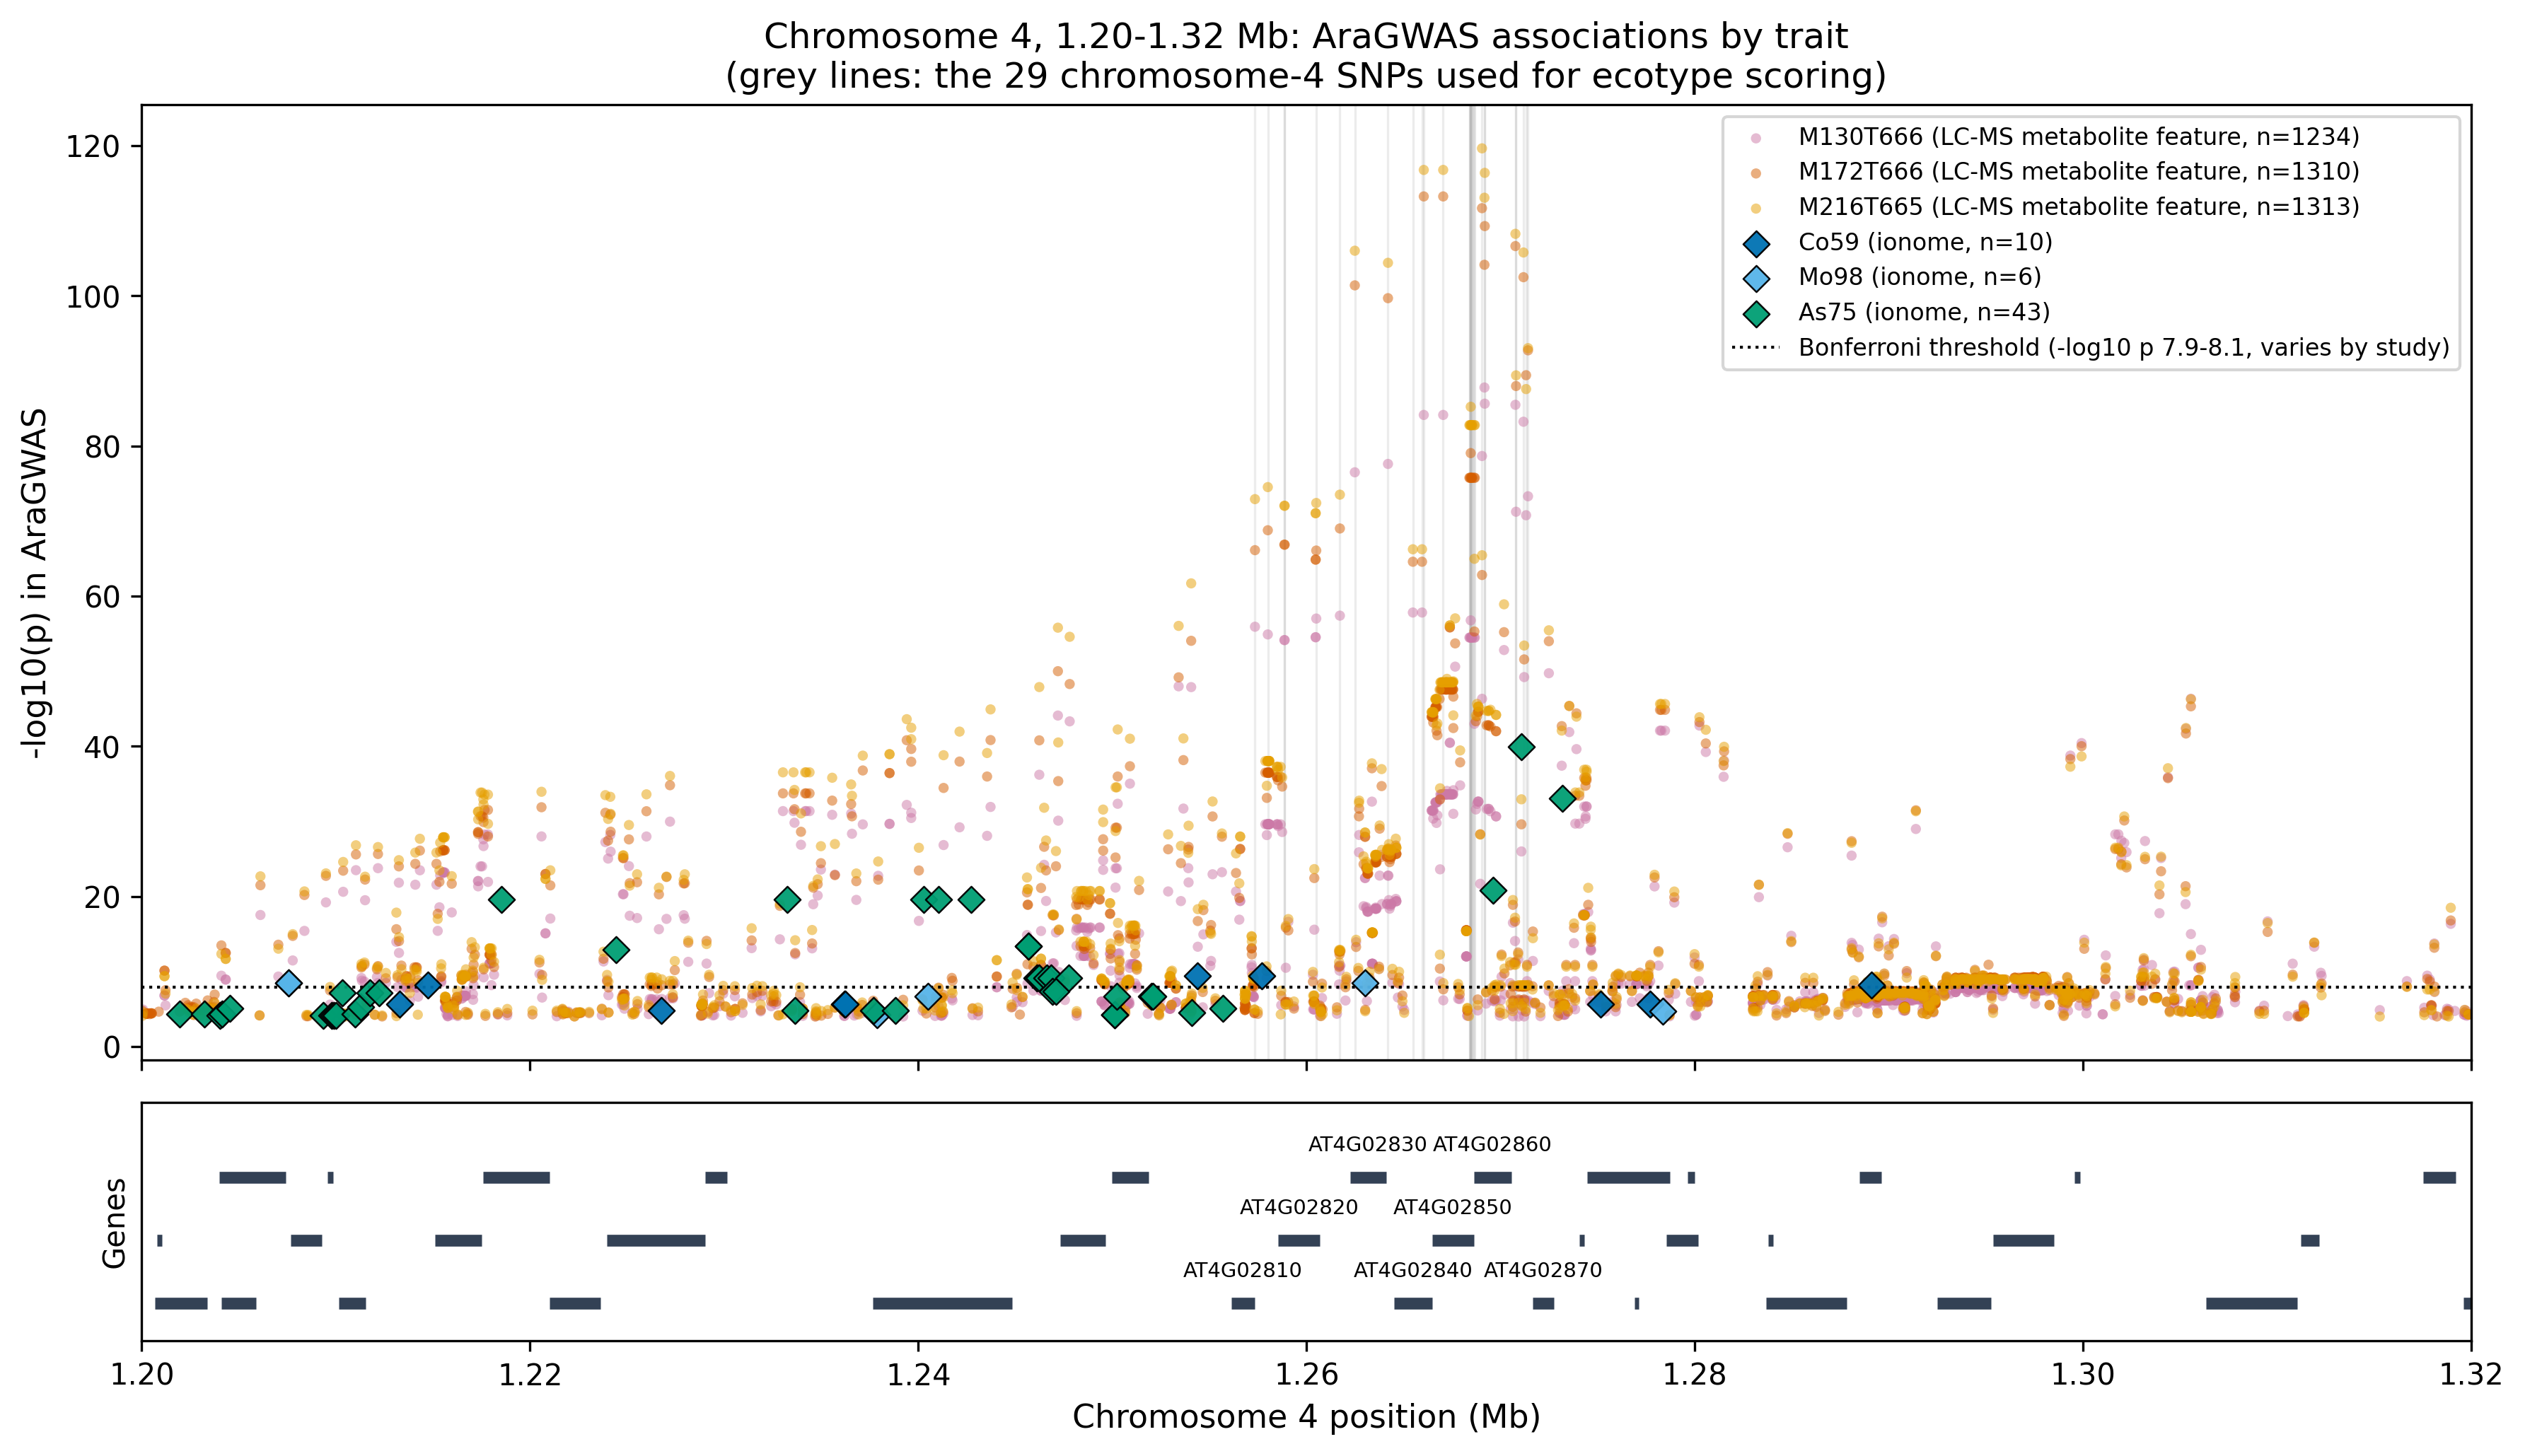
The 31 SNPs used for ecotype scoring are the 31 highest-scoring associations in the AraGWAS catalog, selected on GWAS score alone. Twenty-nine lie in a 14 kb block on chromosome 4 (positions 1,257,343–1,271,408; AT4G02820 to AT4G02860). At those 29 SNPs the AraGWAS associations are with three LC-MS leaf metabolite features (M216T665, M172T666, M130T666); none is shared with an ionome trait (ion_content_locus_sharing.csv). The same block also carries Bonferroni-significant ionome associations at neighbouring SNPs: arsenic (−log10 p up to 40), cobalt and molybdenum. The ecotype scores rest largely on this one block, and nothing in these data links it to spaceflight response.
Statistical Power (Q4)
With only four ecotypes (n = 4) having both spaceflight transcriptomic data and geographic coordinates, correlations between elevation and transcriptomic responses are badly underpowered. For the latitude gradient, the 980 accessions with coordinates give approximately 0.98 power at the observed |ρ| = 0.125 (power_analysis_results.csv).