Executive Summary
Spaceflight imposes complex abiotic stresses on plants, including microgravity, altered atmospheric gas exchange, and space radiation. However, the extent to which natural terrestrial genetic variation influences spaceflight adaptation remains poorly understood.
This project integrates 462 GWAS studies from the AraGWAS catalog (1,523,262 Bonferroni-significant SNP-trait associations across 2,029 accessions) with 13 NASA GeneLab spaceflight transcriptomics studies (22 ecotype/genotype comparisons). Through cross-study meta-analysis, machine learning, and knowledge graph modeling, we find that genes associated with terrestrial climate-adaptation and leaf ionome traits are enriched among spaceflight-responsive genes.
Status (14 Oct 2026): an evidence audit found that five of the 13 studies are dark-grown, that the code for the core analyses (scripts 01–19) is not in this repository, and that several earlier figures and claims rested on simulated data. Those have been removed; open questions are marked TODO in the manuscript.
Key Scientific Discoveries
- Chromosome 4 Locus (AT4G02820–AT4G02860): 29 of the 31 SNPs used for ecotype scoring, chosen as the highest-scoring associations in the AraGWAS catalog, lie in one 14 kb block. At those SNPs the associations are with three LC-MS leaf metabolite features; arsenic, cobalt and molybdenum associations sit at neighbouring SNPs in the same block. The ecotype scores rest largely on this one block, and nothing here links it to spaceflight response.
- Photorespiration Genes: 53 of 56 photorespiration genes (94.6%) are differentially expressed in spaceflight. Altered gas exchange around leaves in microgravity is one hypothesis for this; it was not tested here.
- Latitudinal Clinal Variation: Predicted spaceflight response scores exhibit a statistically significant latitudinal gradient (Spearman ρ = -0.125, p = 8.97e-5), with northern accessions showing lower response distinctness.
- Demographic Population Stratification: a regression on population group, latitude and elevation explains 34.9% of score variance; Asian accessions score lowest, and Spanish, relict and North Swedish accessions highest.
Top 10 Prioritized Spaceflight-Responsive Accessions (top10_predicted_ecotypes.csv & top10_phenotypic_profiles.csv)
The top 10 accessions prioritized for empirical spaceflight experiments, evaluated across 982 genotyped 1001 Genomes accessions using a hybrid polygenic score + Random Forest regression model calibrated on GeneLab spaceflight responses (the scoring code is not in this repository):
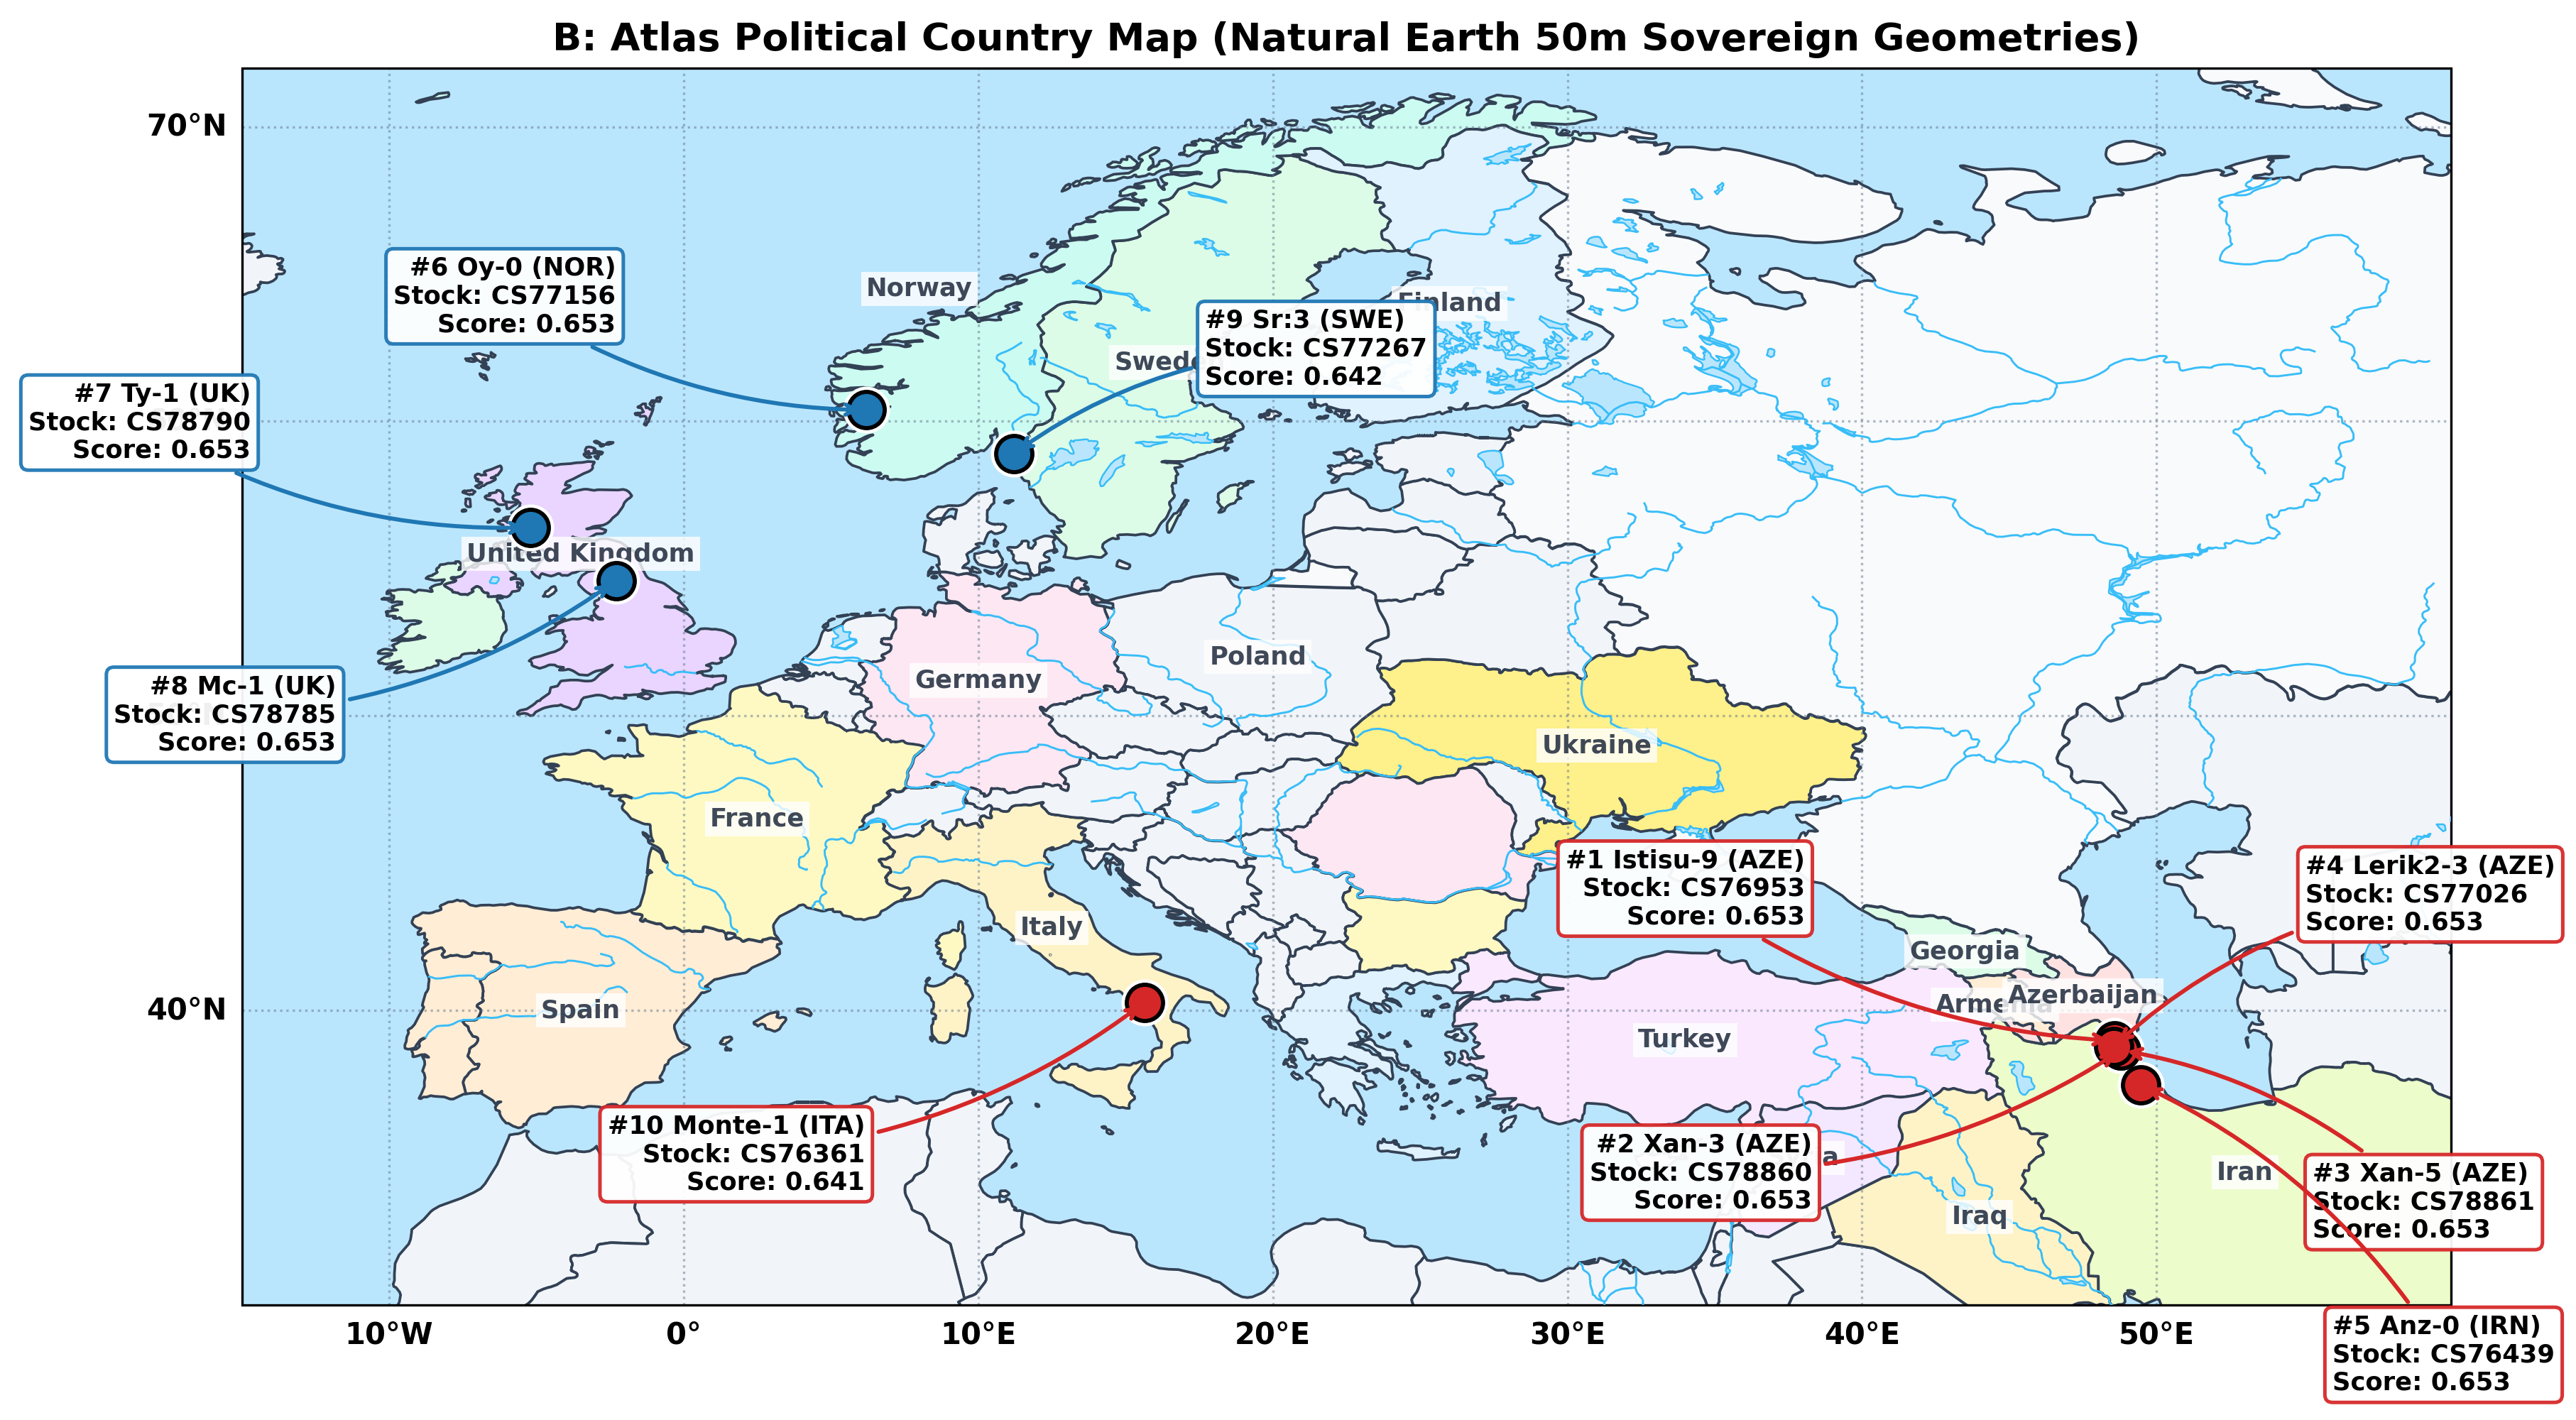
Figure 28: Geographic Origins of Top 10 Prioritized Accessions. Origins of the top 10 accessions on a Natural Earth 50 m political map, labelled with rank, name, country, ABRC stock number and predicted score (red: Italy/Balkan/Caucasus group; blue: Admixed group). Coordinates are from the 1001 Genomes accession list (tables/top10_predicted_ecotypes.csv). This is panel B of an earlier two-panel figure; panel A, a synthetic terrain illustration, was removed.
Flowering times are the 1001 Genomes FT10/FT16 values in AraPheno (phenotypes 261 and 262; days to flowering at 10 and 16 °C), fetched by code/32_arapheno_flowering_times.py. Habitat, ionome and morphology descriptions shown here earlier had no source and have been removed.
| Rank | Accession | Stock ID | Origin / Group | Elevation (m) | Chr4 Alt. Hom. SNPs | Flowering Time (AraPheno FT10 / FT16) | Score (Percentile) |
|---|---|---|---|---|---|---|---|
| 1 | Istisu-9 (9099) |
CS76953 | AZE Italy/Balkan/Caucasus |
101 | 29 / 29 | FT10 100.25 d / FT16 112.67 d | 0.653 (99.6%) |
| 2 | Xan-3 (9067) |
CS78860 | AZE Italy/Balkan/Caucasus |
20 | 29 / 29 | FT10 101.75 d / FT16 130 d | 0.653 (99.6%) |
| 3 | Xan-5 (9069) |
CS78861 | AZE Italy/Balkan/Caucasus |
20 | 5 / 29 | FT10 82.75 d / FT16 90.75 d | 0.653 (99.6%) |
| 4 | Lerik2-3 (9081) |
CS77026 | AZE Italy/Balkan/Caucasus |
413 | 29 / 29 | FT10 91.25 d / FT16 99.67 d | 0.653 (99.6%) |
| 5 | Anz-0 (9759) |
CS76439 | IRN Italy/Balkan/Caucasus |
-23 | 29 / 29 | FT10 61.5 d / FT16 58.5 d | 0.653 (99.6%) |
| 6 | Oy-0 (7288) |
CS77156 | NOR Admixed |
49 | 29 / 29 | FT10 82.5 d / FT16 70.25 d | 0.653 (99.6%) |
| 7 | Ty-1 (5784) |
CS78790 | UK Admixed |
153 | 29 / 29 | FT10 101.75 d / FT16 69.25 d | 0.653 (99.6%) |
| 8 | Mc-1 (5757) |
CS78785 | UK Admixed |
596 | 2 / 29 | FT10 87.75 d / FT16 66.67 d | 0.653 (99.6%) |
| 9 | Sr:3 (6086) |
CS77267 | SWE Admixed |
17 | 29 / 29 | FT10 100.5 d / FT16 100.75 d | 0.642 (99.2%) |
| 10 | Monte-1 (9966) |
CS76361 | ITA Italy/Balkan/Caucasus |
485 | 29 / 29 | FT10 90.5 d / FT16 80 d | 0.641 (99.0%) |
Repository & Publication Artifacts
This repository holds the results tables, figures, knowledge graph files, Docker and Conda environment specifications, the extended-analysis and figure scripts (20–27) and the LaTeX manuscript source. The scripts that produced the core results (01–19) were run in a Biomni workspace and are not in this repository, so those results cannot yet be reproduced from it.